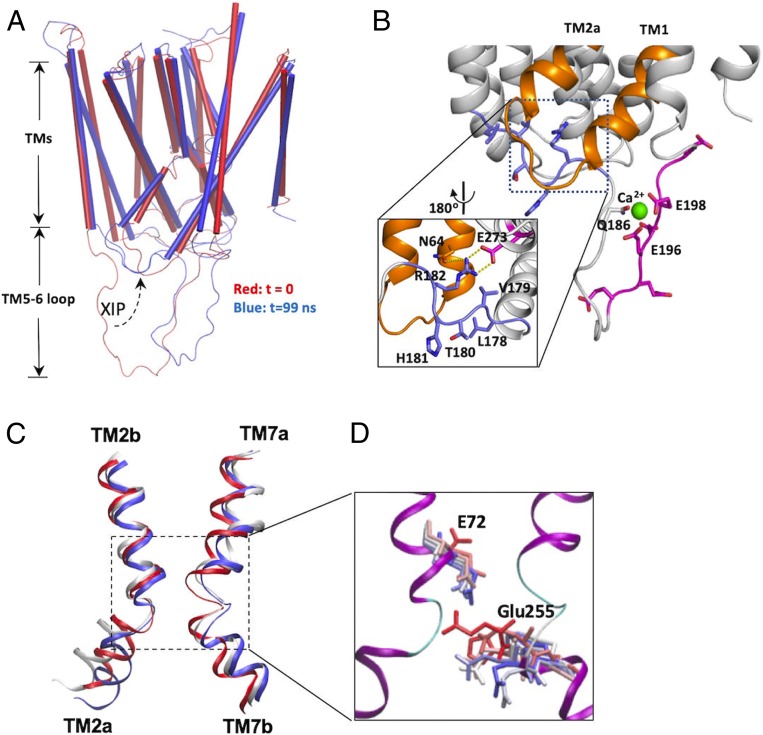
Fig. 4.
MD simulation of YfkE shows Ca2+-mediated conformational changes within the TM5-6 loop. (A) Superimposition of YfkE snapshots at time t = 0 (red) and t = 99 ns (blue); (B) Conformation of the TM5-6 loop (t = 99 ns) showing one Ca2+ (green sphere) coordinated by the residues from the acidic motif (red sticks). The XIP region is highlighted using dashed lines and its interactions in the intracellular cavitiy are demonstrated in the inner panel (black square). The XIP (blue sticks) is stabilized in the intracellular cavity by H-bond interactions (yellow dashed lines) between Arg182 and other residues (red sticks) and is interacted with TMs 1 and 2a (gold). (C) Superimposition of TMs 2 and 7 for snapshots from the trajectory taken at t = 0 (red), 50 (white), and 99 ns (blue); the region of the transport Ca2+ site is highlighted using dashed lines and is further demonstrated in detail in D. (D) superimposition of residues Glu72 and Glu255 in MD snapshots colored from red (0 ns) through blue (99 ns).

