Fig. 2.
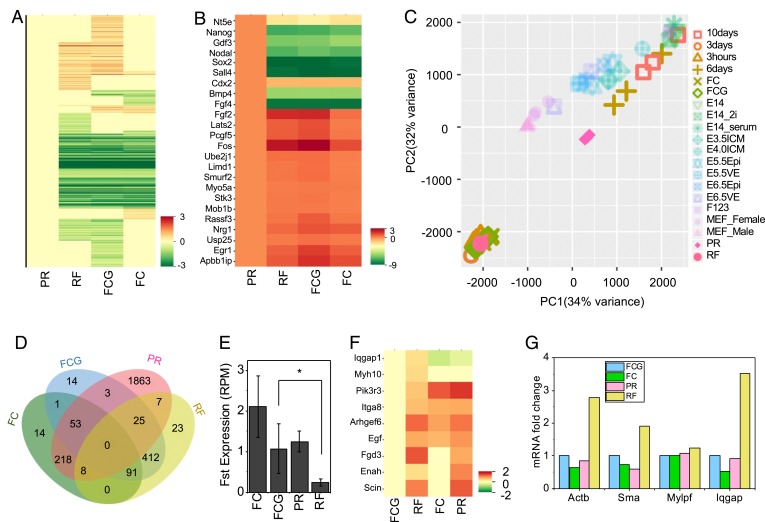
A shift in transcription profile accompanied with enhanced cytoskeletal genes’ expression. (A) Heatmap showing fold change (log2) in global transcription profiles between PR, RF, FCG, and FC cells. FDR (adjusted P value) < 0.1. (B) Heatmap showing log2 fold change in the differential day 6 partially expression of selected genes (compared to the PR sample). FDR (adjusted P value) < 0.1. (C) PCA showing the shift in cell states through reprogramming and reverting back through redifferentiation. FDR (adjusted P value) < 0.01 and |log2 fold change| > 2. (D) Venn diagram showing the number of up-regulated genes in 14 (2n – 2; n is four conditions) comparisons. FDR (adjusted P value) < 0.1. (E) Bar plot depicting changes in the expression of the representative aging gene Fst. The error bars represent ± SD. *P < 0.1. (F) Heatmap showing the log2 fold change in the differential expression of selected cytoskeletal-related genes (compared to FCG). P value (not adjusted) < 0.05. (G) mRNA levels of selected cytoskeletal genes obtained by qRT-PCR, normalized with respect to FCG.

