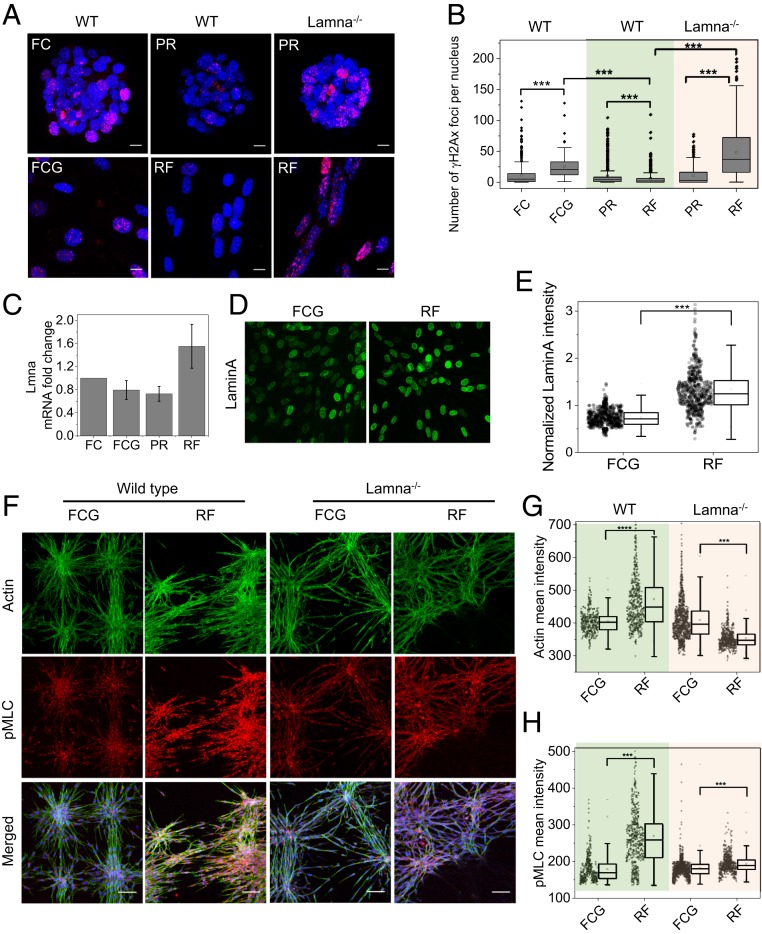
Fig. 4.
Recovering from age-associated hallmarks DNA damage by partial reprogramming and LaminA dependency. (A) Representative gH2AX immunofluorescence micrographs of cell nuclei in different conditions: with and without gel and in both wild-type 3T3 (WT) and Lmna knockout 3T3 cell lines (Lamna−/−). (Scale bars, 10 µm.) (B) Corresponding box plots of gH2AX foci per nucleus. n = 549, 93, 522, 473, 323, and 545 for respective conditions. ***P < 0.001. Two-sided Student’s t tests were used. (C) mRNA levels of Lmna in different conditions obtained by qRT-PCR normalized with respect to NIH 3T3 clumps on patterns; error bars represent SD. (D) Representative LaminA immunofluorescence micrographs of the nuclei in fibroblasts and 3T3 cells embedded in the collagen matrix. (Magnification: 200×.) (E) Corresponding box plot for normalized nuclear LaminA intensities. n = 633 and 554 for FCG and RF conditions, respectively. ***P < 0.001. Two-sided Student’s t tests were used. (F) Representative actin and pMLC immunofluorescence micrographs of fibroblasts and 3T3 cells embedded in collagen matrix in both WT and Lmna−/− conditions. In merged images, nucleus is in blue. (Scale bars, 50 µm.) (G and H) Corresponding box plots for cellular mean intensity of actin and pMLC; n = 400, 558, 1,114, and 619 for the respective conditions. ***P < 0.001; ****P < 0.0001. Two-sided Student’s t tests were used.

