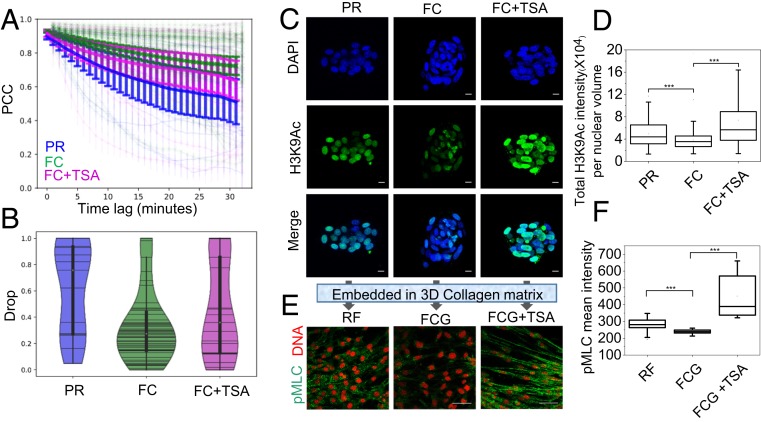
Fig. 5.
Chromatin poised state in PRs. (A) PCC curve of projected nuclear area as a function of time with mean and CI of mean (as error bar). n = 38, 138, and 122 for PR, FC, and FC+TSA conditions, respectively. (B) Drop rate obtained by fitting the nuclear area PCC curves of A, indicating the rapid change of nuclear morphology and DNA organizations in PR and FC+TSA conditions. The procedure of analysis of A and B is described in Methods. (C) Representative H3K9Ac immunofluorescence micrographs of the nuclei in Day6, 3T3 clump, and 3T3 clump+ TSA-treated cells without gel conditions. (Scale bars, 10 µm.) (D) Corresponding box plots of total H3K9Ac intensities per nuclear volume. n = 383, 788, and 903 for PR, FC, and FC+TSA, respectively. ***P < 0.001. Two-sided Student’s t tests were used. (E) Representative pMLC immunofluorescence micrographs of the above-mentioned cell types embedded in collagen matrix for 2 d. Nucleus is labeled in red. (Scale bars, 50 µm.) (F) Corresponding box plots of mean pMLC intensities in these three conditions. Numbers of fields of view used for analysis are n = 23, 58, and 15 for RF, FCG, and FCG+TSA, respectively. ***P < 0.001. Two-sided Student’s t tests were used.

