Fig. 6.
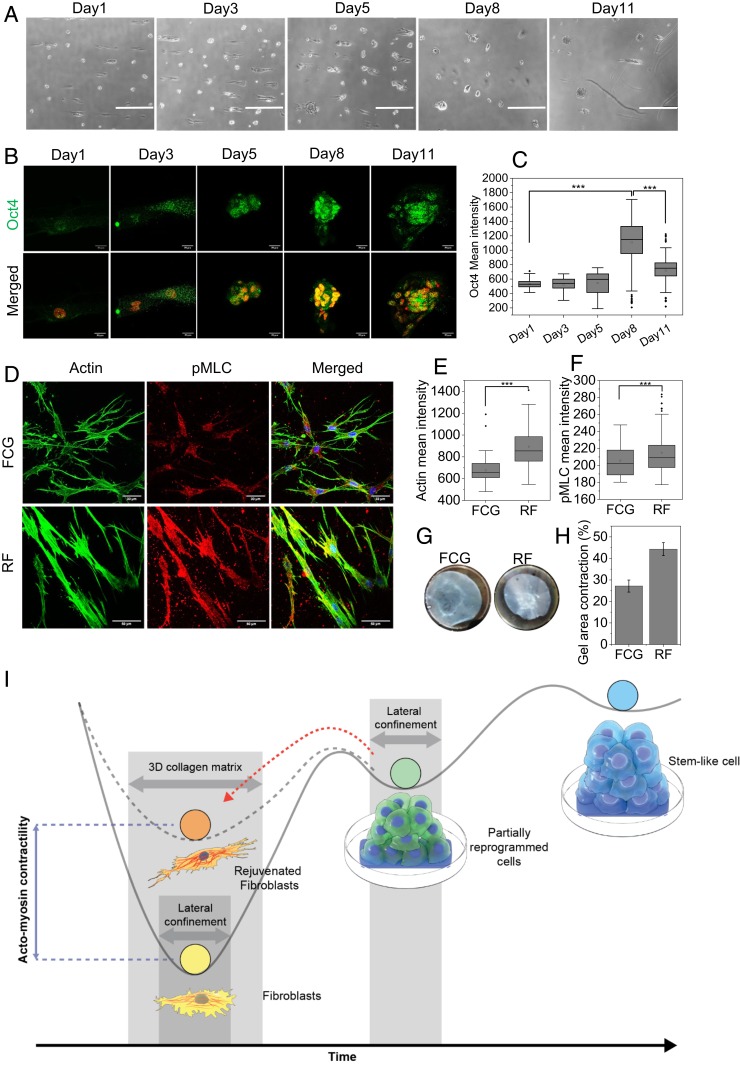
Rejuvenation of human aged fibroblasts. (A) Phase-contrast images of human primary aged skin fibroblast (GM08401) cells cultured on micropatterns for up to 11 d. (Scale bars, 500 µm.) (B) Representative micrograph of GM08401 spheroids at different days immunostained with Oct4. (Scale bars, 20 µm.) (C) Nuclear Oct4 mean intensity plot of spheroids at different days. ***P < 0.001. (D) Representative actin and pMLC immunofluorescence micrograph of RF and FCG of GM08401 embedded in 1 mg/mL collagen matrix. (Scale bars, 33 µm [Upper] and 50 µm [Lower].) (E and F) Corresponding box plots for cellular mean intensity of actin and pMLC in FCG and RF conditions, respectively. ***P < 0.001. Two-sided Student’s t tests were used. (G) Representative images of collagen-gel contraction by matrix embedded with GM8401 RF and FCG. (H) Normalized gel area plot representing the gel-contraction efficiencies of these two types of cells. (I) Schematic summary of the induction of reprogramming by laterally confined growth of cells and followed by redifferentiation into RFs in 3D collagen matrix.

