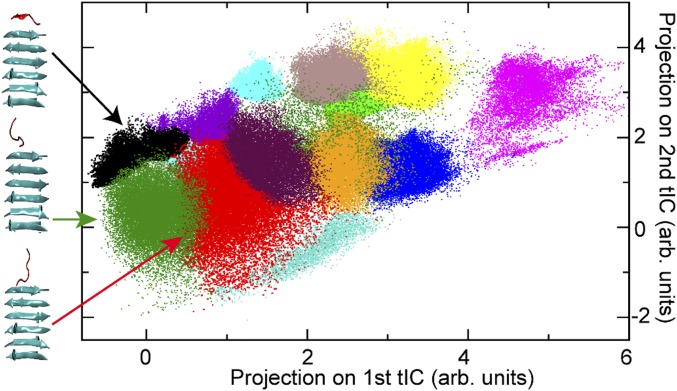
Fig. 3.
Nonregistered states identified from kinetic clustering. The simulation trajectories were clustered based on time-lagged independent component analysis (tICA). The states are projected on first two tICAs. The three clusters connected to registered states are colored in black, green, and red. Representative conformations (cluster centers) of the incoming peptide (red) and on the fibril surface (cyan) are shown. Note, as the cluster is based on three-dimensional tICA, some clusters are covered by other clusters and do not show up in the 2D projection.

