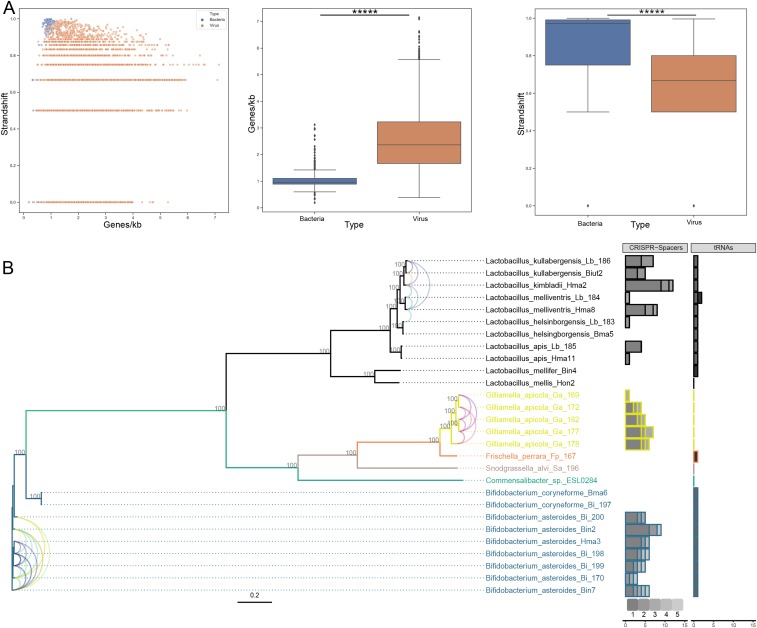
Fig. 2.
Retrieved prokaryotic viruses display a significant difference in genomic variables and infect a wide range of known bee-gut bacteria. (A) Frequency of strand shift in function of coding density (number of ORFs per kilobase). Data from the bacterial dataset are indicated in blue; data from the viral dataset are indicated in orange. Boxplots for individual parameters are also denoted, and asterisks designate significance (Mann–Whitney U test; P value for coding density = 5.10−164; P value for strand shift frequency = 4.10−87). The box shows the three quartile values, and the whiskers extend to 1.5 interquartile ranges of the lower and upper quartile. Dots independently drawn fall outside of this range. (B) Maximum-likelihood phylogenetic tree for bacterial sequences included in the host-calling effort. Gray integers indicate bootstrap values. The tree is colored according to bacterial genera. Number of contigs linked to a specific bacterial species are indicated by the stacked horizontal bar plots (CRISPR-spacer counts and tRNA similarity). Shades of gray indicate the number of specific bacterial species that gave hits to a single contig (CRISPR spacers) or indicate a specific viral contig (tRNA similarity). Single contigs displaying CRISPR-spacer hits to multiple bacteria are indicated with colored tax links between the tips. A single color corresponds to a single contig.

