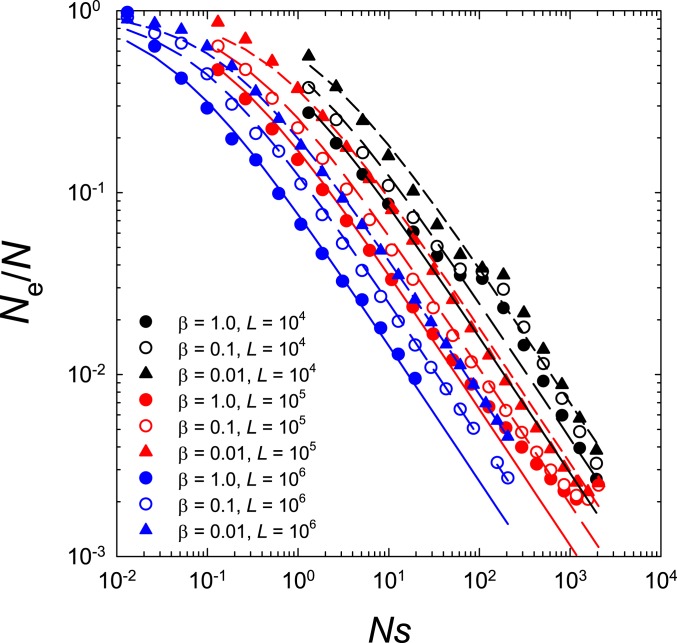
Fig. 6.
Depression in the effective population size as a function of , , and . Points are estimates from the average behavior in simulations, whereas the solid lines map the expected behavior based on Eq. 11. As noted in the text, is varied by keeping the deleterious mutation rate constant (although varying at each population size) and modifying .

