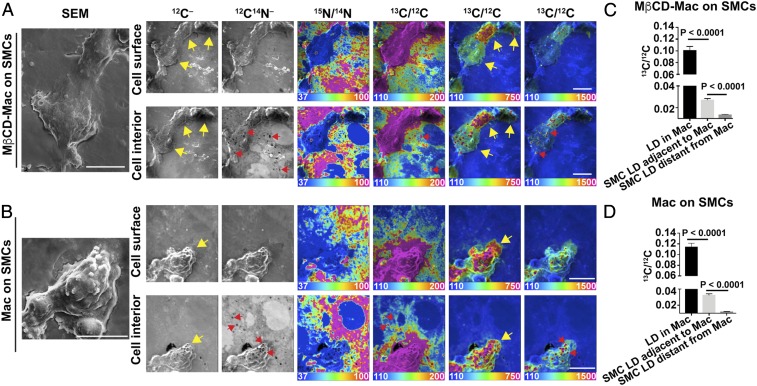
Fig. 5.
Transfer of [13C]cholesterol from [13C]cholesterol-loaded macrophages to adjacent SMCs. [13C]cholesterol-loaded macrophages were plated onto a monolayer of [15N]choline-labeled SMCs (∼90 to 95% confluency). (A) NanoSIMS images (from the cell surface and the cell interior) of [13C]cholesterol-loaded macrophages that had been incubated with MβCD for 30 min before plating onto the SMCs. In this image, there are three macrophages with varying amounts of 13C enrichment (yellow arrows). (B) NanoSIMS images (from the cell surface and the cell interior) of a [13C]cholesterol-loaded macrophage that had not been preincubated with MβCD (yellow arrows). Cytosolic lipid droplets (LDs) (red arrows) are visible in the 12C14N– images. Ratio scales were multiplied by 10,000. SEM images of the macrophages are shown to the Far Left. (Scale bars: 10 µm.) Additional images of macrophages (both MβCD-untreated and treated)) from this experiment are shown in SI Appendix, Figs. S9 and S10. (C) 13C/12C ratios (mean ± SD) in macrophage cytosolic LDs (n = 17 droplets in five regions of 40 μm × 40 μm), LDs in SMCs immediately adjacent to the macrophage (n = 158 droplets in nine regions of 40 μm × 40 μm), and LDs in distant SMCs (n = 8 droplets in one region of 40 μm × 40 μm) for images containing MβCD-treated macrophages. (D) 13C/12C ratios (mean ± SD) in macrophage cytosolic LDs (n = 179 droplets in six regions of 40 μm × 40 μm), LDs in SMCs immediately adjacent to the macrophage (n = 1,167 droplets in 9 regions of 40 μm × 40 μm), and LDs in distant SMCs (n = 368 droplets in three regions of 40 μm × 40 μm) for images containing macrophages that were not pretreated with MβCD.

