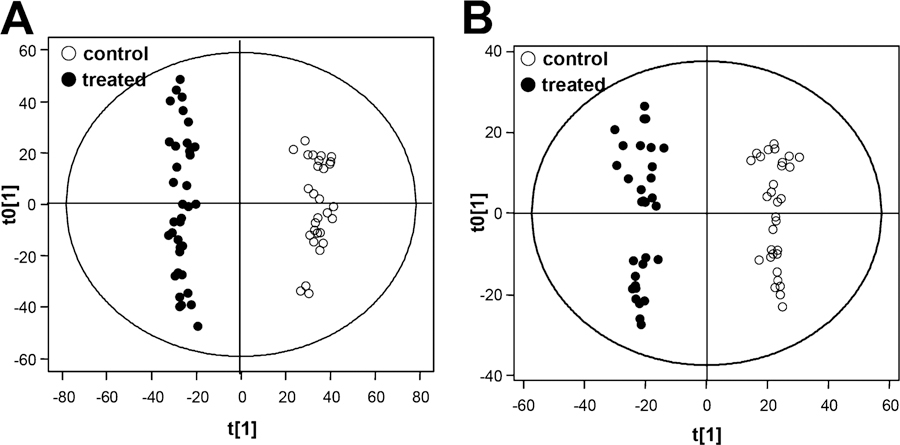
Figure 3.

Results of OPLS-DA analysis of the control and senecionine-treated groups. A shows the OPLS-DA score plots generated by ESI- data; B shows the OPLS-DA score plots generated by ESI+ data. (○) represents the control group; and (●) represents the senecionine-treated group. All data were generated through UPLC−QTOF−MS analysis.
