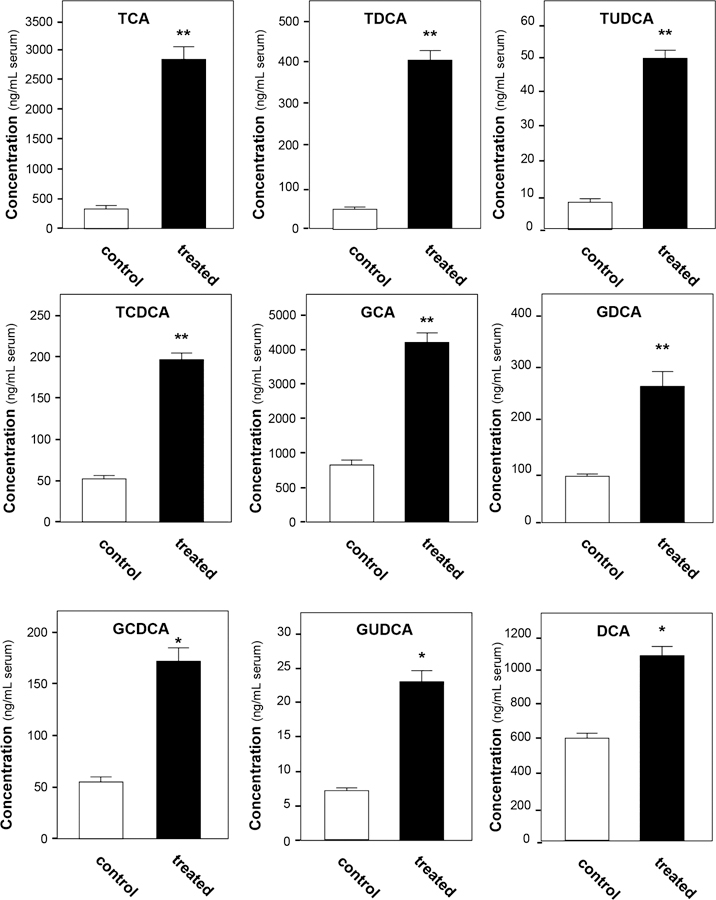
Figure 4.

Serum bile acid content significantly changed in the senecionine-treated group. Values were expressed as the mean ± SEM; significant differences between the control group (n = 12) and treated group (n = 12) are based on two-tailed unpaired Student’s t-tests (*p < 0.05 and **p < 0.01). All data were generated through UPLC−MS analysis.
