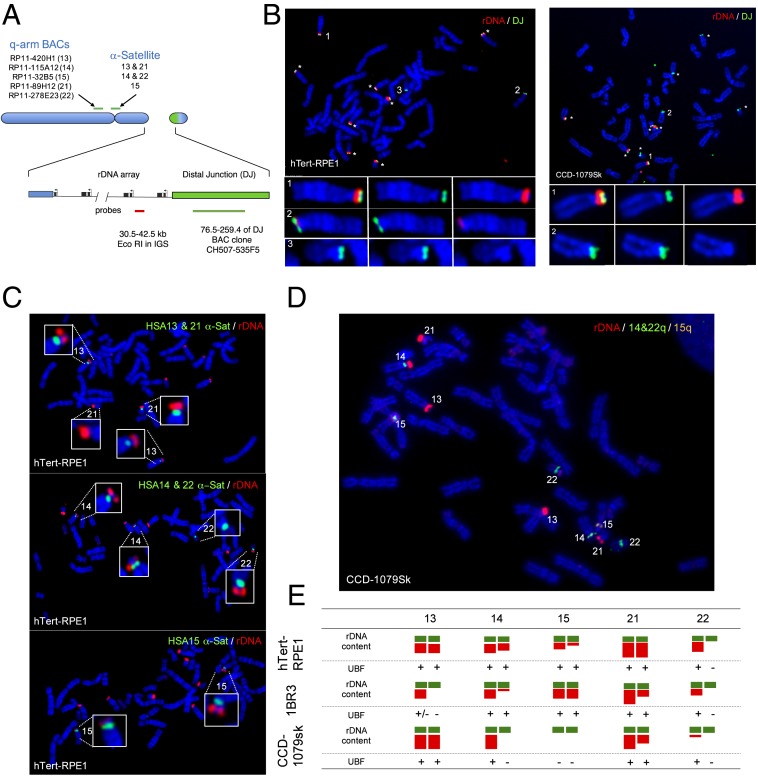
Fig. 1.
The chromosomal distribution of rDNA in nontransformed human cell lines. (A) Schematic showing the FISH probes used in this study. (B) FISH performed on metaphase spreads prepared from hTert-RPE1 (Left) and CCD-1079Sk (Right) cells. rDNA and DJ probes are in red and green, respectively, and chromosomes were stained with DAPI. (C) FISH performed on metaphase spreads prepared from hTert-RPE1 with rDNA (red) and α-satellite probes indicated. Note that α-satellite probes from HSA13 and HSA21 cross-react, as do HSA14 and HSA22. The HSA15 probe is unique to that chromosome. (D) CCD-1079Sk metaphase spreads probed with rDNA (red), HSA14 and HSA22 α-satellite (green), and HSA15 (red and green, resulting in yellow). Note that HSA13 and HSA21 are distinguished by size. (E) NOR ideograms for hTert-RPE1, 1BR3, and CCD-1079Sk cells. The relative rDNA contents (red) for each NOR are shown below a DJ (green). Chromosomal identities are shown on top, and UBF loading status is indicated under each NOR ideogram.

