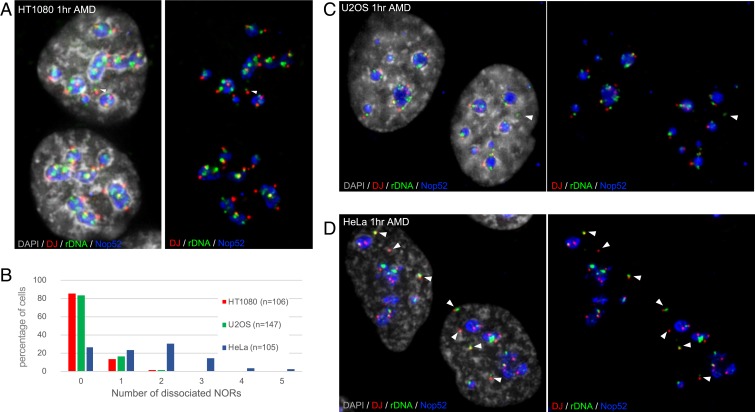
Fig. 6.
Localization of NORs in HT1080, U2OS, and HeLa cancer cell lines. (A) 3D immuno-FISH performed on HT1080 cells. Nop52 antibodies (far red; pseudocolored here in blue) used to visualize nucleoli were combined with DJ and rDNA FISH probes (red and green, respectively). Nuclei were visualized by DAPI staining (pseudocolored here in gray). An NOR dissociated from nucleoli in the upper cell is indicated by an arrowhead. (B) Quantitation of 3D immuno-FISH showing the percentages of HT1080, U2OS, and HeLa cells in which zero, one, two, three, four, or five non–nucleolar-associated NORs are observed. Cell identities and number of cells analyzed are indicated. (C and D) 3D immuno-FISH performed on U2OS cells (C) and HeLa cells (D), as above. Non–nucleolar-associated NORs are indicated by arrowheads.

