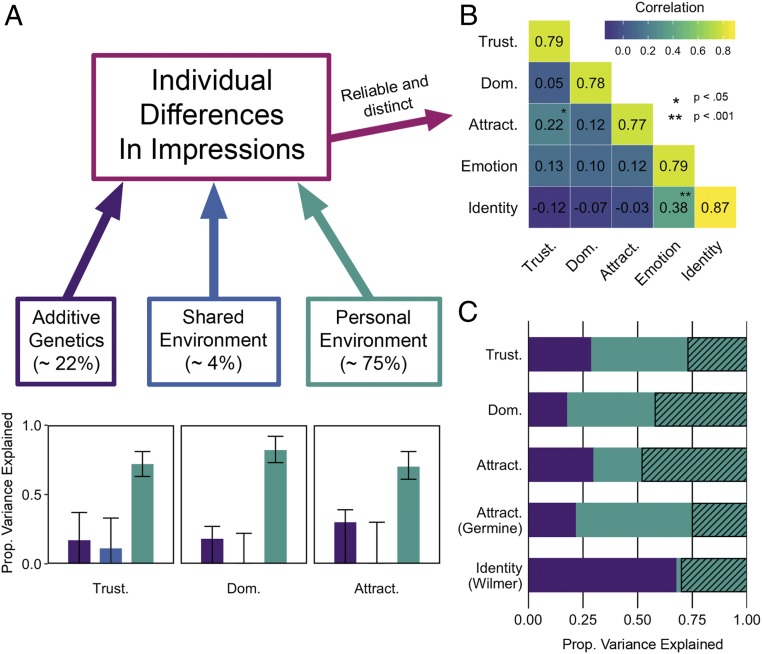
Fig. 2.
(A) Additive genetic (purple), shared environment (blue), and personal environment contributions (green; including measurement error) to proportion (Prop.) variance explained in individual facial impressions, including ACE estimates averaged across the three impressions (boxes above) as well as individual univariate ACE models (bars below; n = 1,153, N observations = 3,426) (SI Appendix). Error bars represent 95% CIs with a lower bound of zero. (B) Individual differences in facial impressions are stable, with high internal reliability (shown on the diagonal, reliabilities are split-half and corrected for attenuation). Individual differences in facial impressions of trustworthiness (Trust.), attractiveness (Attract.), and dominance (Dom.) dissociate and also diverge from individual differences on identity recognition and expression labeling ability (shown on the off-diagonal, measured by Pearson’s correlations). Data are from a nontwin participant group tested in the laboratory (n = 214, N observations = 1,070) (SI Appendix). (C) Best-fitting univariate AE twin models depicting variance explained in individual facial impressions from the twin sample, together with variance explained in individual facial attractiveness and facial identity recognition performance from different twin samples recruited from the same registry (12, 18). Hashing indicates upper-bound for estimates of additive genetic contribution, based on test–retest reliability.

