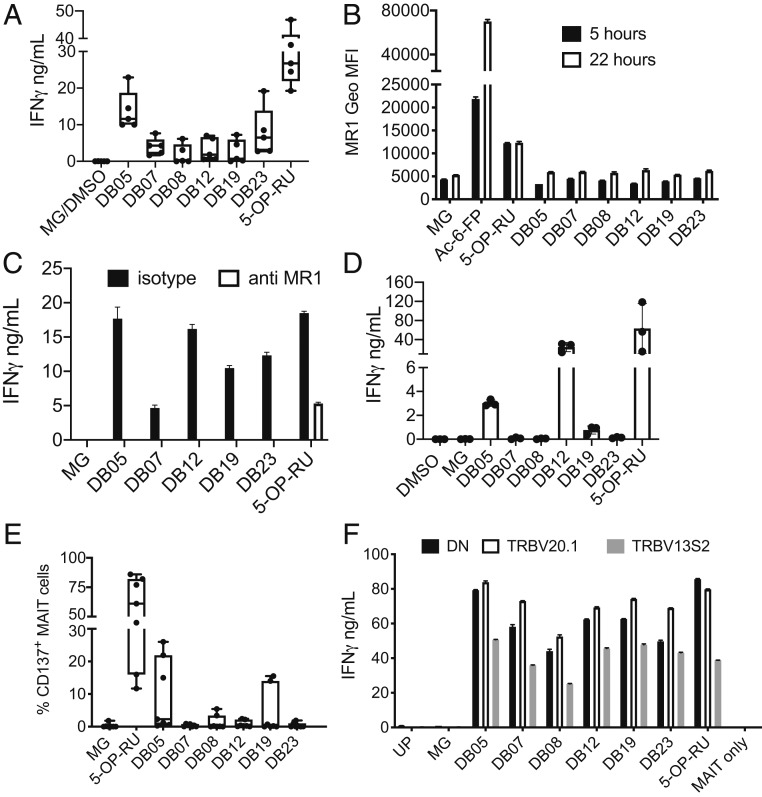
Fig. 1.
MAIT cell stimulation by the DB series of agonists. (A) THP1-MR1 cells were pulsed with the indicated compounds (100 μM MG, 20 μg/mL DB compounds, 50 ng/mL 5-OP-RU) and incubated with MAIT cells. IFN-γ was measured in the supernatant after 36 h of coculture. Box and whiskers bars, minimum to maximum, with all points indicated; n = 5. (B) The DB series of MAIT cell agonists do not induce MR1 up-regulation. THP1-MR1 cells were pulsed 5 or 22 h with 20 μg/mL of the indicated compounds, 100 μM MG, 1 μg/mL Ac-6-FP, or 1 μg/mL 5-OP-RU. Depicted is the cell surface expression of MR1 at 5 h (black bars) or 22 h (white bars) measured by FACS. Data are mean ± SD of technical duplicates. One experiment is representative of two. (C) MR1-dependent presentation of the DB series of agonists. THP1-MR1 cells were pulsed with the indicated compounds (100 μM MG, 20 μg/mL for DB compounds, 50 ng/mL for 5-OP-RU) and incubated with MAIT cells in the presence of isotype control or blocking anti-MR1 antibodies. IFN-γ was measured in the supernatant after 36 h of coculture. Data are mean ± SD of technical duplicates. One experiment is representative of two. (D) DC were pulsed with the indicated compounds (100 μM MG, 20 μg/mL DB compounds, 50 ng/mL 5-OP-RU) and incubated with MAIT cells. IFN-γ was measured in the supernatant after 36 h of coculture. Average from technical duplicates from three different donors. One experiment is representative of two. (E) Ex vivo MAIT cell activation by the DB series of agonists. Whole blood was stimulated overnight with the indicated compounds. MAIT cell activation, depicted as percentage of CD137 expression, was assessed by flow cytometry. Box and whiskers bars, minimum to maximum, with all points indicated; n = 7. (F) TCRβ chain expression influences reactivity to DB MAIT cell agonists. MAIT cells expressing TRBV20.1, TRBV13S2, and neither of those two chains (DN) were sorted from a single donor and incubated with THP1-MR1 pulsed with the indicated compounds (100 μM MG, 20 μg/mL for DB compounds, 50 ng/mL for 5-OP-RU). UP, unpulsed. IFN-γ was measured in the supernatant after 36 h of coculture. Data are mean ± SD of technical duplicates. One experiment is representative of two.

