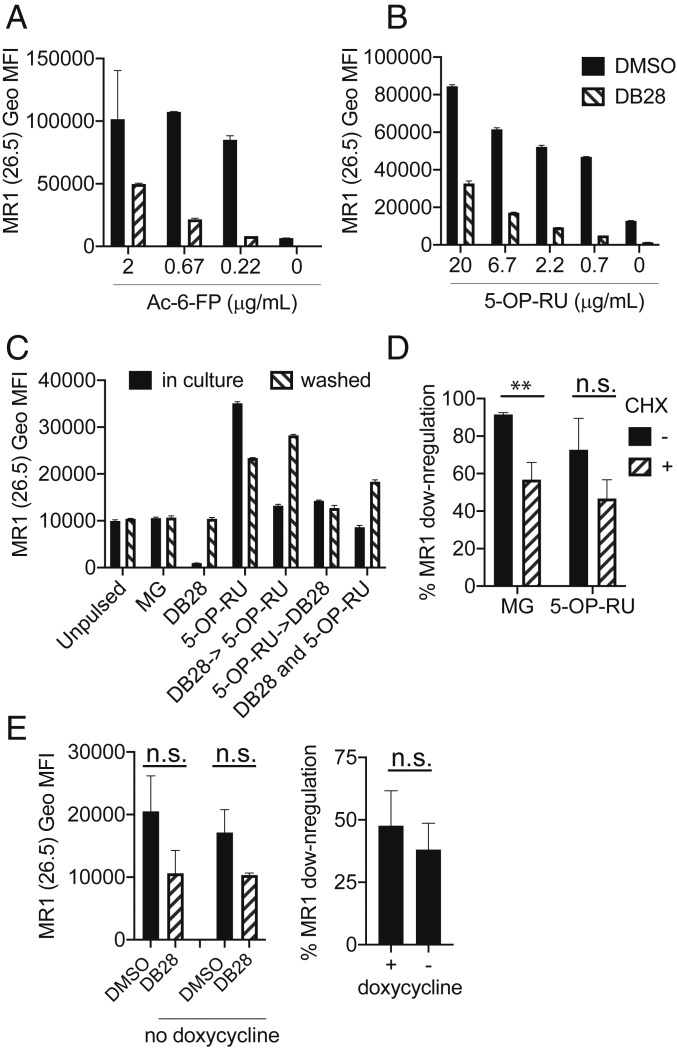
Fig. 4.
DB28 competes with 5-OP-RU for MR1 binding. (A and B) THP1-MR1 cells were pulsed with 20 μg/mL DB28 for 2 h before addition of the indicated concentrations of Ac-6-FP (A) or 5-OP-RU (B). Cells were stained after 18 h. (C) THP1-MR1 cells were pulsed with 20 μg/mL DB28 2 h before, concurrently, or 2 h after addition of 5-OP-RU (5 μg/mL). The compounds were kept in culture for 7 h or were washed after 2 h, and cells were chased for 5 h before staining with anti-MR1 (26.5) antibody. Geo MFI ± SD of technical duplicates are plotted in each graph. Data (A–C) are representative of three experimental replicates. (D) THP1-MR1 cells were pulsed with 20 μg/mL DB28 and MG or 5-OP-RU in the presence (hatched bars) or absence (black bars) of 10 μM cycloheximide (CHX) to block protein synthesis. Plotted is the percentage of MR1 down-regulation for each experimental condition (n = 4 experimental replicates for MG, 3 for 5-OP-RU; multiple t test, **P ≤ 0.005). (E) MR1-GFP expression was induced in BEAS2B cells with doxycycline; after 16 h, cells were pulsed with DB28 (20 μg/mL) for 8 h in the presence or absence of doxycycline. Geo MFI ± SD of surface MR1 expression (Left) or percentage of MR1 down-regulation (Right) are plotted. n = 5 experimental replicates with doxycycline, 3 without (t test, n.s).

