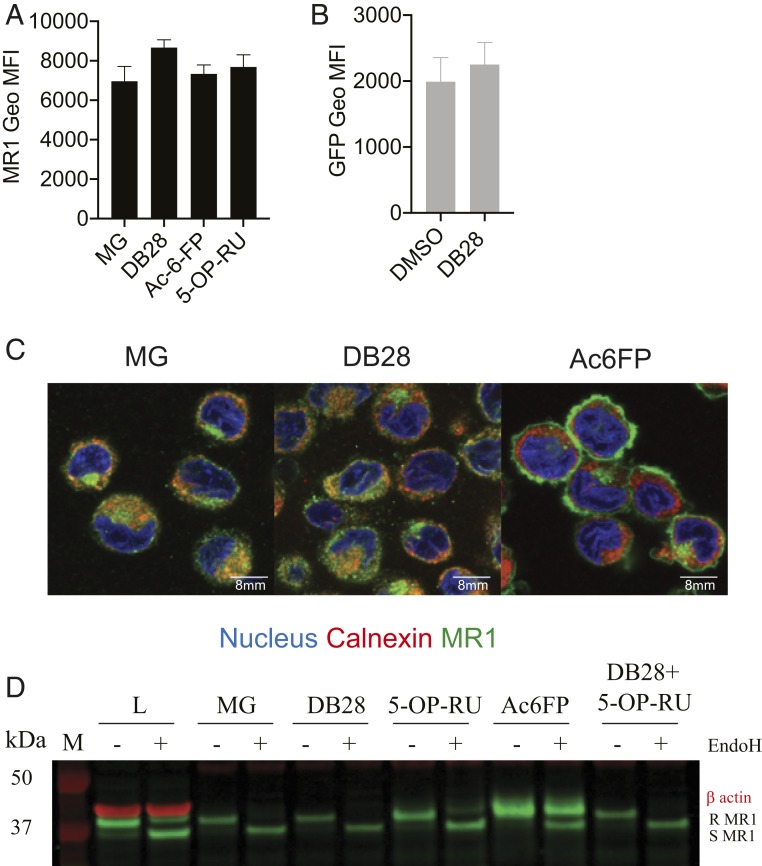
Fig. 6.
DB28 retains MR1 molecules in the ER/Golgi in an EndoH-sensitive conformation. (A) THP1-MR1 cells were pulsed overnight with the indicated ligands (MG 50 μM, Ac-6-FP 1 μg/mL, 5-OP-RU 5 μg/mL, DB28 20 μg/mL) before staining with a polyclonal anti-MR1 antibody. (B) BEAS2B expressing MR1-GFP tagged were pulsed overnight with DB28 (20 μg/mL). Plotted is the Geo MFI ± SD of GFP expression of technical duplicates. One experiment is representative of two. (C) Confocal images of THP1-MR1 cells pulsed overnight with MG 50 μM, Ac-6-FP 1 μg/mL, or DB28 20 μg/mL. Cells were stained with DAPI (blue), anti-calnexin (red), and anti-MR1 26.5 (green). Images were processed as described in the Methods. (Scale bar, 8 μm.) Images are representative of one experiment out of five; cumulative Pearson correlation coefficient is shown in SI Appendix, Fig. S8. (D) THP1-MR1 cells were pulsed overnight with the indicated ligands (MG 50 μM, Ac-6-FP 1 μg/mL, 5-OP-RU 5 μg/mL, DB28 20 μg/mL), and MR1 molecules were immunoprecipitated with 26.5 antibody. Shown is the analysis of EndoH treated (+) or not (–) MR1 molecules (green) from lysates (L) or the indicated immunoprecipitates. β-actin (red) was determined in the lysate as the loading control. Samples were processed as described in the Methods. R, EndoH-resistant; S, EndoH-sensitive. One experiment is representative of three.

