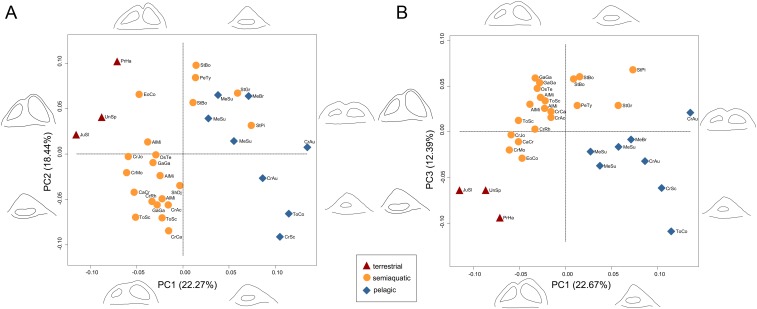
Fig. 3.
Bony labyrinth shape morphospaces, showing the distribution of extinct and extant crocodylomorphs of different habitats, based on principal component analysis of 3D landmarks. (A) PC1 vs. PC2; (B) PC1 vs. PC3. Labyrinth outline diagrams correspond to morphological extremes at the ends of PC axes, in lateral and dorsal views. For taxa abbreviations see SI Appendix, Table S1.

