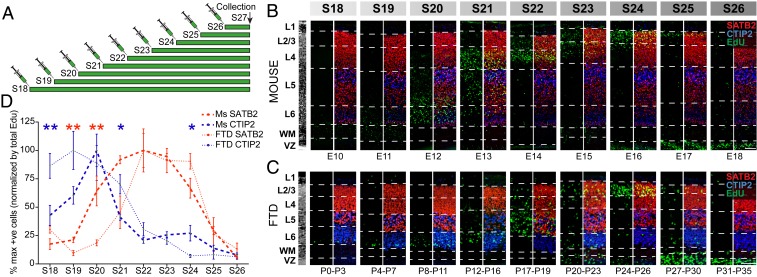
Fig. 3.
Birth-dating analysis reveals overlapping peaks in the neurogenic timing of mature SATB2- and CTIP2-positive cells between mice and dunnarts. (A) Schematic of EdU injection protocol, where animals of both species were injected at various stages (S) of development and collected at the same stage of mature cortical development (late stage 27). (B and C) Neocortical Insets showing qualitative dynamics of EdU localization (green) between mouse (B) and dunnart (C) injected with EdU at different stages of development. (D) Counts of cells labeled with EdU and costained for either SATB2 (red in B and C) or CTIP2 (blue in B and C), normalized by the average number of EdU-labeled cells (green in B and C) at each stage per species, and presented as a percentage of the peak value for each cell type (% max). Data are presented as mean ± SEM, n ≥ 3 animals per condition. Mann–Whitney U tests, *P < 0.05; **P < 0.01. E, embryonic day; FTD, fat-tailed dunnart; L, layer; Ms, mouse; P, postnatal day; S, stage; VZ, ventricular zone; WM, white matter. (Scale bars, 100 µm.)

