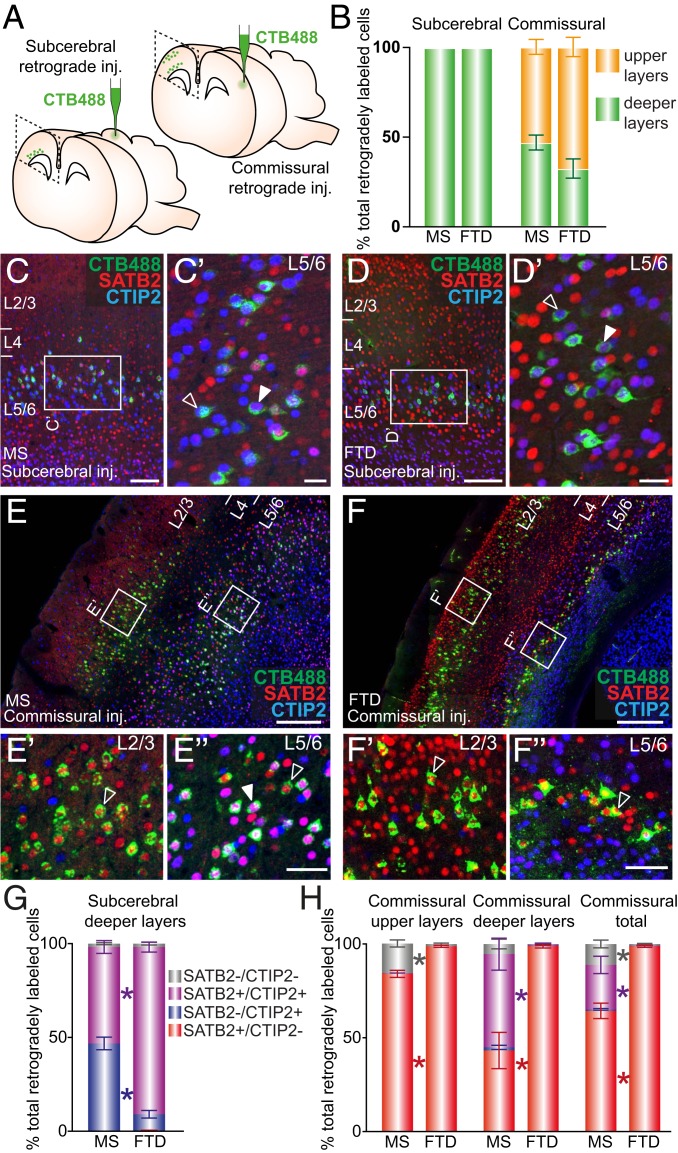
Fig. 4.
Subcerebral and commissural long-range projection neurons predominantly express CTIP2 and SATB2, respectively, in both mouse and dunnart. (A) Schematics depict experimental protocol. (B) Quantification of the distribution of retrogradely labeled cell bodies in the primary somatosensory cortex in each species upon each CTB injection reveals conservation of the laminar distributions. (C and D) Example of a mouse (C) and dunnart (D) primary somatosensory cortex after CTB (green) injection into the tectum, followed by immunostaining for SATB2 (red) and CTIP2 (blue). Filled arrowheads in C′ and D′ show corticotectal cells coexpressing both SATB2 and CTIP2, whereas empty arrowheads indicate corticotectal cells expressing CTIP2 alone. (E and F) Example of a mouse (E) and dunnart (F) primary somatosensory cortex after CTB (green) injection into the contralateral homotopic cortex, and immunostaining for SATB2 (red) and CTIP2 (blue). Filled arrowheads show cells coexpressing SATB2 and Ctip2 and empty arrowheads indicate cells expressing SATB2 alone. (G and H) Quantification of the percentage of retrogradely labeled cells expressing SATB2 and/or CTIP2 or neither following subcerebral injections (G) or contralateral homotopic injections (H). Data are presented as mean ± SEM, n ≥ 4 animals per condition. Mann–Whitney U tests, *P < 0.05. Inj., Injection; CTB, cholera-toxin B; Ms, mouse; FTD, fat-tailed dunnart; L, layer. (Scale bars: [C–D] 125 µm and 25 µm for Insets; [E and F] 250 µm and 50 µm for Insets.)

