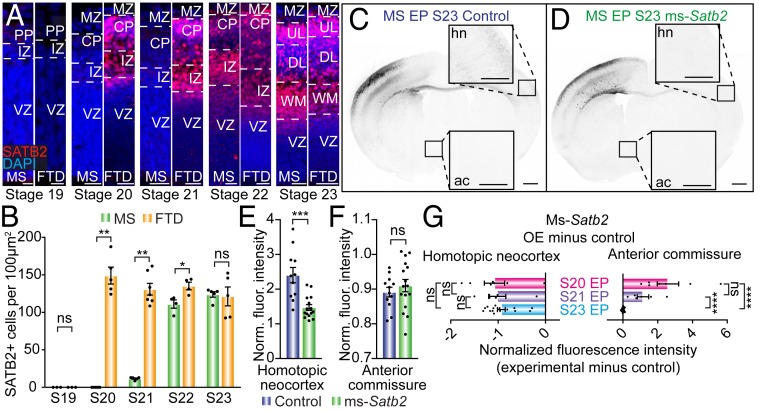
Fig. 8.
Heterochronic expression of SATB2 may underlie the difference in commissural routes between eutherians and marsupials. (A) Time course of mouse (Left) or dunnart (Right) sections, immunostained for SATB2 (red) and counterstained with DAPI (blue). (B) Quantification of the number of SATB2-positive cells averaged across the cortical plate and intermediate zone for mouse and dunnart at each developmental stage, revealing a significant delay in the onset of SATB2 expression in mouse compared to dunnart. (C and D) Example images of mice electroporated at stage 23 (E15) with TdTomato, either alone (control; c) or with ms-Satb2 (D). (E–F) Quantification of the normalized fluorescence intensity of electroporated axons in control or ms-Satb2 overexpression conditions in the contralateral homotopic neocortex or anterior commissure. (G) Quantification of the degree change between experimental (ms-Satb2 overexpression) and control conditions for three ages of Satb2 electroporation, all collected at S28/P10 (S20/E12 raw values from Fig. 7; S21/E13 raw values in SI Appendix, Fig. S5) for the homotopic neocortex and anterior commissure. Data are presented as mean ± SEM, n ≥ 3 animals per condition; each scatterdot represents a single animal. Mann–Whitney U tests, *P < 0.05; **P < 0.01; ***P < 0.001; ****P < 0.0001. Ac, anterior commissure; CP, cortical plate; DL, deeper layers; FTD, fat-tailed dunnart; hn, homotopic neocortex; IZ, intermediate zone; MS, mouse; MZ, marginal zone; ns, not significant; OE, overexpression; PP, preplate; S, stage; UL, upper layers; VZ, ventricular zone; WM, white matter. (Scale bars: [A] 10 µm for stage 19, 25 µm for stages 20 to 22, 50 µm for stage 23; [C and D] 500 µm for whole brains, 250 µm for homotopic neocortex and anterior commissure Insets.)

