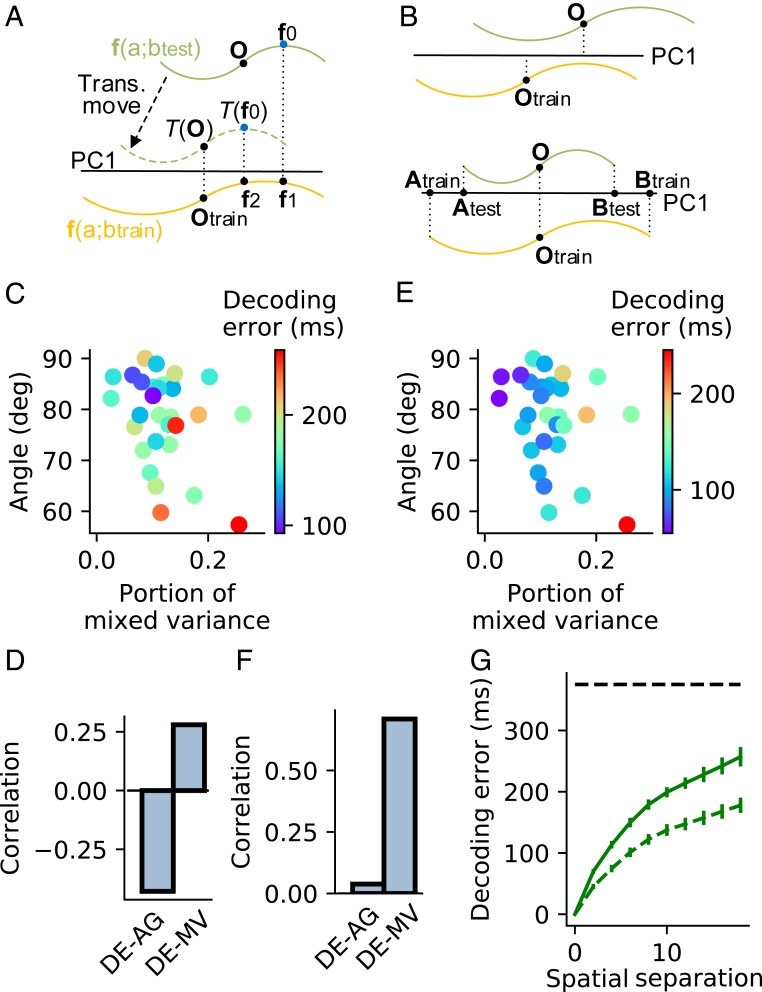
Fig. 4.
Decoding generalizability. (A) A schematic that explains Decoder 1 and Decoder 2. The decoders read the value of through state in iso- line (green) after being trained by another iso- line (orange). Decoder 1 reads to be the same as that of because and project to the same point on PC1 (black horizontal line) of . Decoder 2 first translationally moves so that its mass center after translational movement projects to the same point as the mass center of on PC1 and then reads according to , which is the value of . (B) Two error sources of Decoder 1. (B, Upper) The mass centers and do not project to the same point on PC1. (B, Lower) The projections of and on PC1 (lines and ) do not have the same length. (C) The error of Decoder 1 (indicated by dot color) to read temporal flow across different spatial locations as a function of the angle (AG) and mixed variance (MV) between the temporal flow and spatial subspaces in the production epoch of t-SR task. (D) Correlations between decoding error (DE) and AG and between DE and MV. (E and F) The same as C and D except for Decoder 2. (G) DE as a function of after Decoder 1 (solid line) or Decoder 2 (dashed line) is trained to read the temporal flow using the isospace line at spatial location and then tested at spatial location . The horizontal dashed line indicates chance level, supposing that the decoder works by random guess. Error bars represent mean SEM across simulation trials. C–F analyze the data averaging over in individual training configurations. ms. Decoding generalizability in other epochs of the t-SR task and the t-DM task is shown in SI Appendix, Figs. S7 and S8.

