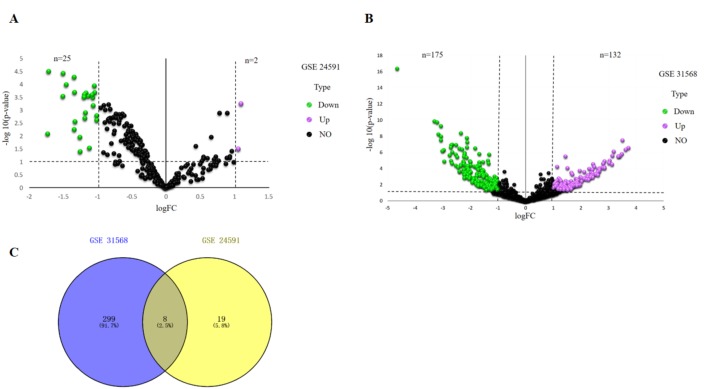
Figure 1. Identification of differentially expressed miRNAs analysis.
(A) Volcano plot of differentially expressed miRNAs in GSE24591. The red dot represents upregulated miRNAs and the green dot represents downregulated miRNAs. (B) Volcano plot of differentially expressed miRNAs in GSE31568. The red dot represents upregulated miRNAs and green dot represents downregulated miRNAs. miRNAs, microRNAs. (C) A Venn-diagram between GSE24591 and GSE31568. The coincident part represents the differentially expressed genes shared by the two series, accounting for a total of eight.

