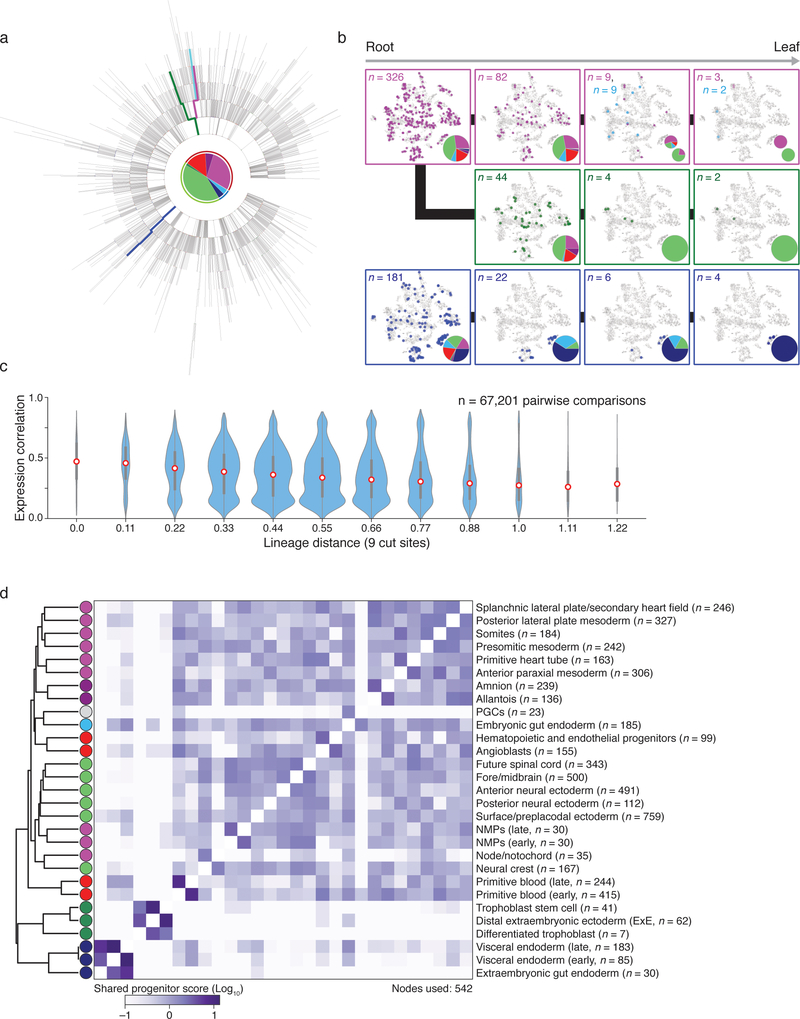
Extended Data Figure 8: Single cell lineage reconstruction of early mouse development for embryo 6.
a. Reconstructed lineage tree comprised of 2,690 nodes generated from our most information-dense embryo (embryo 6), which we used to compare shared progenitor scores with embryo 2 in Figure 4d. Each branch represents an independent indel generation event, and each node contains a pie chart of the germ layer proportions for the cells contained within it (colors are as in Figure 3b).
b. Example paths from root to leaf from the selected tree (highlighted by color). Cells for each node in the path are overlaid onto the t-sne representation in Extended Data Figure 5, with the tissue proportion at each node in the tree included as a pie chart. In the top most path (pink), the lineage bifurcates into two independently fated progenitors that either generate mesoderm (secondary heart field/splanchnic plate mesoderm and primitive heart tube) or neural ectoderm (anterior neural ectoderm and neural crest). Note that the middle path (green) also represents an earlier bifurcation from the same tree and eventually produces neural ectoderm (neural crest and future spinal cord). These paths begin with a pluripotent node that can generate visceral endoderm but subsequently lose this potential. Alternatively, the bottom path (dark blue) begins in an equivalently pluripotent state but becomes restricted towards the extraembryonic visceral endoderm fate.
c. Violin plots representing the relationship between lineage and expression for individual pairs of cells as calculated for embryo 2 in Figure 4c. Expression Pearson correlation decreases with increasing lineage distance, showing that closely related cells are more likely to share function. Red dot highlights the median, edges the interquartile range, and whiskers the full range.
d. Comprehensive clustering of shared progenitor scores for Embryo 6, which has the greatest number of unique alleles and samples multiple extraembryonic tissues. Shared progenitor score is calculated as the sum of shared nodes between cells from two tissues normalized by the number of additional tissues that are also produced (a shared progenitor score is calculated as 2−(n−1) where n is the number of clusters present within that node). In general, extraembryonic tissues that are specified before implantation, such as extraembryonic endoderm or ectoderm, co-cluster away from embryonic tissues and within their own groups, while the amnion and allantois of the extraembryonic mesoderm cluster with other mesodermal products of the posterior primitive streak. The co-clustering of anterior paraxial mesoderm and somites may reflect the continuous nature of somitogenesis from presomitic mesoderm during this period, with production of only the most anterior somites by E8.5. Note that the gut endoderm cluster has been further portioned according to embryonic or extra embryonic lineage (see Figure 5).

