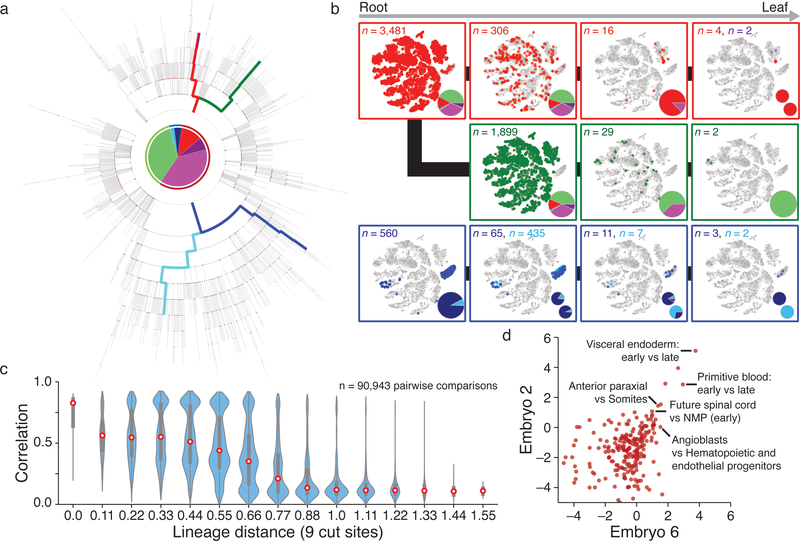
Figure 4: Single cell lineage reconstruction of mouse embryogenesis.
a. Reconstructed lineage tree comprised of 1,732 nodes for embryo 2 with three lineages highlighted. Each branch represents an indel generation event.
b. Example paths from tree in a highlighted by color. Cells for each node in the path are overlaid onto the plot from Figure 3b, with tissue proportions as a pie chart. Tissue representation decreases with increased tree depth, indicating functional restriction. Bifurcating sublineages are included for the top and bottom paths. In the top (red) path, this bifurcation occurs within the final branch after primitive blood specification. In the bottom (blue) path, bifurcation happens early within bipotent cells that become either gut or visceral endoderm.
c. Violin plots of the pairwise relationship between lineage and expression for single cells. Lineage distance uses a modified Hamming distance normalized to the number of shared cut sites. Pearson correlation decreases with increasing lineage distance, showing that closely related cells are more likely to share function. Red dot highlights the median, edges the interquartile range, and whiskers the full range.
d. Comparison of shared progenitor scores (log2-transformed) between our two most information-dense embryos (Embryo 2, n = 1,400 alleles; Embryo 6, n = 2,461 alleles). Cells from closely related transcriptional clusters (ex. primitive blood or visceral endoderm, which have early and late states) derive from common progenitors and score as highly related in both embryos. We also observe a close link between mesoderm and ectoderm that may reflect shared heritage between neuromesodermal progenitors (NMPs) and more posterior neural ectodermal tissues, such as the future spinal cord42.

