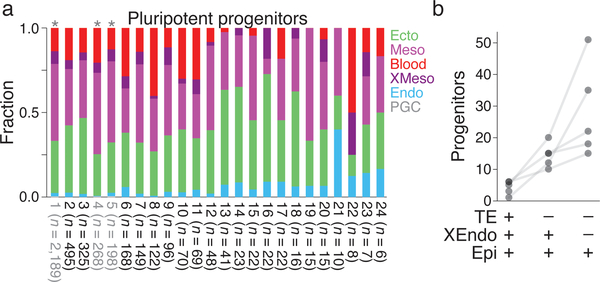
Figure 6: Lineage bias and estimated size of progenitor pools.
a. Relative tissue distribution of cells descended from reconstructed or profiled pluripotent progenitor cells for embryo 2. “Profiled” is a unique lineage identity of multiple cells directly observed in the data. Pluripotent cells form all germ layers, but show asymmetric propensities towards different cell fates, possibly reflecting positional biases. Nodes highlighted in grey with asterisk overlasy give rise to primordial germ cells (lineages 1, 4, and 5 include 9, 1, and 1 PGCs each). Color assignments as in Figures 3.
b. Estimated progenitor field sizes for three types of early developmental potency. Totipotent cells give rise to all cells of the developing embryo, including trophectodermal (TE) lineages. Pluripotent progenitors are partitioned into early and late by generation of extra-embryonic endoderm (XEndo) in addition to epiblast (Epi). Dots represent single embryos; solid grey line connects estimates from the same embryo.

