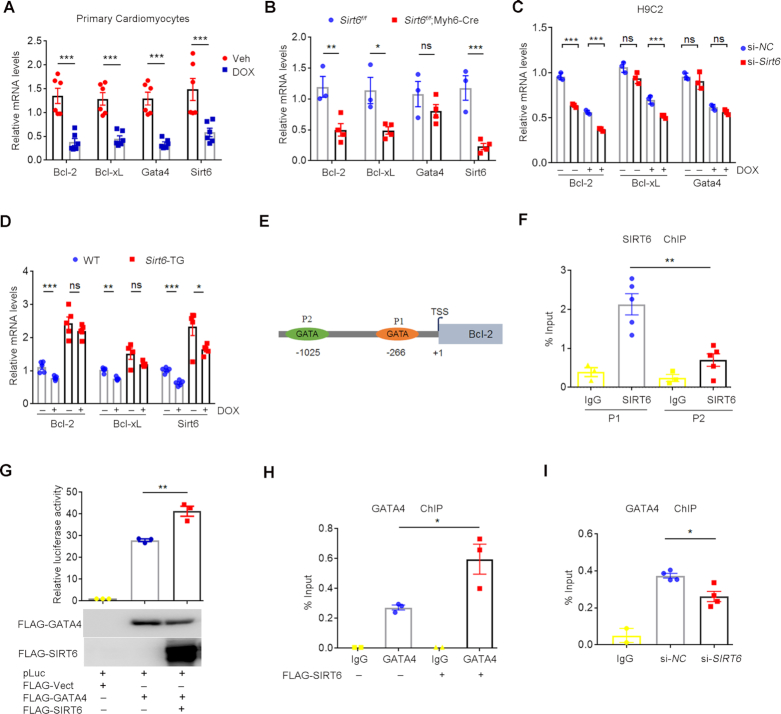
Figure 1.
SIRT6 antagonizes DOX-induced apoptotic pathway in cardiomyocytes via GATA4. (A) Quantitative PCR (qPCR) showing the mRNA levels of Bcl-2, Bcl-xL, Gata4 and Sirt6 in primary mouse cardiomyocytes after the treatment of DOX (1 μM) for 6 h. ***P < 0.001. (B) qPCR results showing the mRNA levels of Bcl-2, Bcl-xL, Sirt6 and Gata4 in heart tissues isolated from Sirt6f/f and Sirt6f/f;Myh6-Cre mice treated with tamoxifen. *P < 0.05, **P < 0.01, ***P < 0.001, ‘ns’ indicates no significance. (C) H9C2 cells with si-NC (negative control) or si-Sirt6 small interfering (si)RNAs were exposed to DOX (1 μM, 6 h). The mRNA levels of Bcl-2, Bcl-xL and Gata4 were determined by quantitative PCR. ***P < 0.001, ‘ns’ indicates no significance. (D) qPCR results showing the mRNA levels of Bcl-2, Bcl-xL and Sirt6 in wild-type (WT) and Sirt6 transgenic (Sirt6-TG) mice after intraperitoneal injection of DOX (n = 5/group). *P < 0.05, **P < 0.01, ***P < 0.001, ‘ns’ indicates no significance. (E) Schematic illustration of the GATA consensus motif on Bcl-2 promoter region. P1 and P2 indicate –266 GATA motif and –1025 GATA motif respectively. TSS represents the transcription start site of the Bcl-2 gene. (F) ChIP was performed using anti-SIRT6 antibodies and IgG. Enrichment of SIRT6 on the Bcl-2 promoter region was analyzed by qPCR with primers targeting the P1 and P2 motifs. **P < 0.01. (G) HEK293 cells were transfected with indicated plasmids, and the luciferase activities were measured and normalized to β-gal activities. **P < 0.01. The western blots indicate the expression levels of FLAG-GATA4 and FLAG-SIRT6. (H) ChIP was performed to test GATA4 enrichment on the Bcl-2 promoter using anti-GATA4 antibody in HEK293 cells with or without FLAG-SIRT6 overexpression. *P < 0.05. (I) ChIP was performed to test GATA4 enrichment on the Bcl-2 promoter using anti-GATA4 antibody in HEK293 cells with si-NC or si-SIRT6. *P < 0.05.

