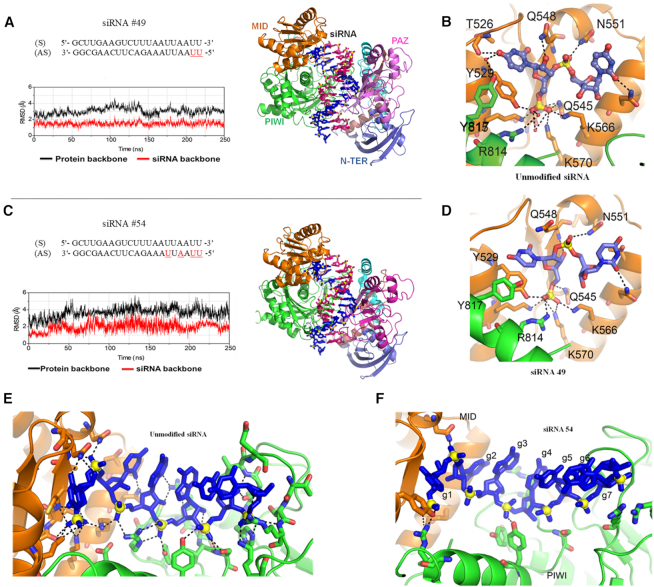
Figure 7.
MD snapshots averaged from the last 50 ns of the MD simulations and root-mean-square deviation (RMSD) graphs from the MD simulations of the 2′-5′ linked siRNAs #49 (A) and #54 (B) and hAGO2. hAGO2 is presented in cartoon, each domain of the protein is labelled in a different colour; siRNA backbone is presented in ball and stick with AS strand in magenta and passenger strand in blue. RMSD graphs were calculated over 250 ns using equilibrated structures as the reference with hAGO2 displayed in black and siRNA displayed in red. Non-covalent interactions between hAGO2 and 5′ terminal of unmodified siRNA (C), (E); siRNA #49 (D) and siRNA #54 (F) are displayed. Key non-covalent interactions between hAGO2 and siRNAs are labelled in black dashed line. Legend: 3′-5′ linked nucleotides (black), 2′-5′ linked nucleotides (red).

