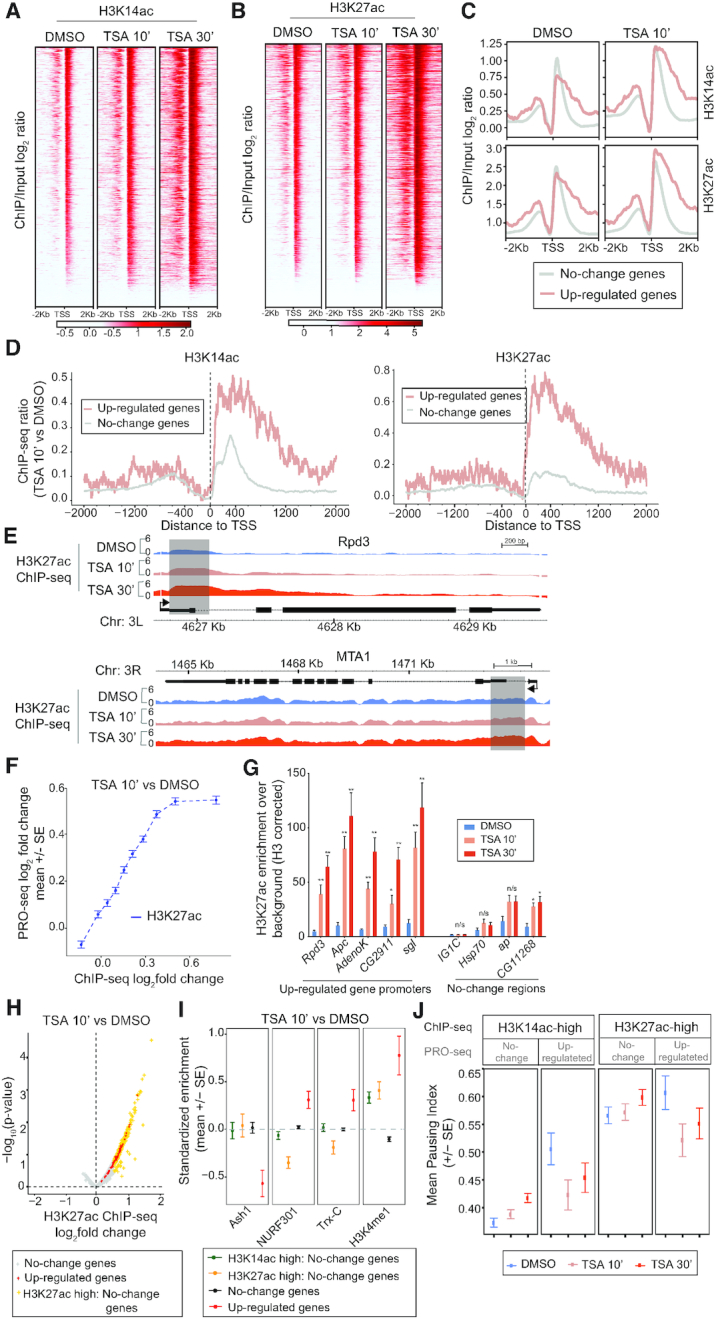
Figure 4.

Gain in histone acetylation after HDAC inhibition correlates with transcriptional output and is greatest in the first 2 kb of up-regulated genes. (A and B) Heatmaps of H3K14ac (A) and H3K27ac (B) ±2 kb around the TSS in DMSO, TSA 10 min and TSA 30 min-treated cells sorted on the level of acetylation. (C) Metagene plots of H3K14ac (top) and H3K27ac (bottom) ±2 kb around the TSS for 96 up-regulated and non-affected genes in DMSO and 10 min TSA-treated cells. (D) H3K14ac (left) and H3K27ac (right) log2 fold-change ±2 kb around the TSS at up-regulated and unaffected genes. (E) H3K27ac log2 ChIP-seq signal over input at the Rpd3 and MTA1 loci in DMSO, TSA 10 min and TSA 30 min-treated cells. Regions with a strong increase after 10 min are shaded. (F) Correlation between H3K27ac promoter (±1 kb around TSS) fold change and PRO-seq gene body fold change. (G) H3K27ac ChIP-qPCR at up-regulated gene promoters and control loci from S2 cells treated with DMSO or TSA for 10 or 30 min normalized against H3 occupancy. n = 3. Error bars represent SEM and significant differences between control and TSA-treated cells (two-tailed paired t-test) are indicated by asterisks, * P< 0.05, ** P< 0.01. (H) H3K27ac ChIP-seq peak (±1 kb around TSS) fold changes after 10 min TSA. The peak with the largest change per gene was plotted. The 96 up-regulated genes are labeled red, and PRO-seq gene body unchanged (FDR > 0.5) with >1.5-fold H3K27ac increase are labeled orange. (I) Average standardized enrichment scores (z-scores) of Ash1, NURF301, Trithorax (Trx-C) and H3K4me1 in gene promoters with >1.5-fold increase in H3K14ac or H3K27ac without a transcriptional change, in PRO-seq unchanged with less acetylation changes, and in 96 up-regulated gene promoters. (J) Mean pausing index (based on PRO-seq) for genes with >1.5-fold increase in H3K14ac (left) or H3K27ac (right) where PRO-seq gene body reads do not change or are increased after 10 min of TSA treatment in DMSO, TSA 10 min and TSA 30 min-treated S2 cells.
