Figure 5.
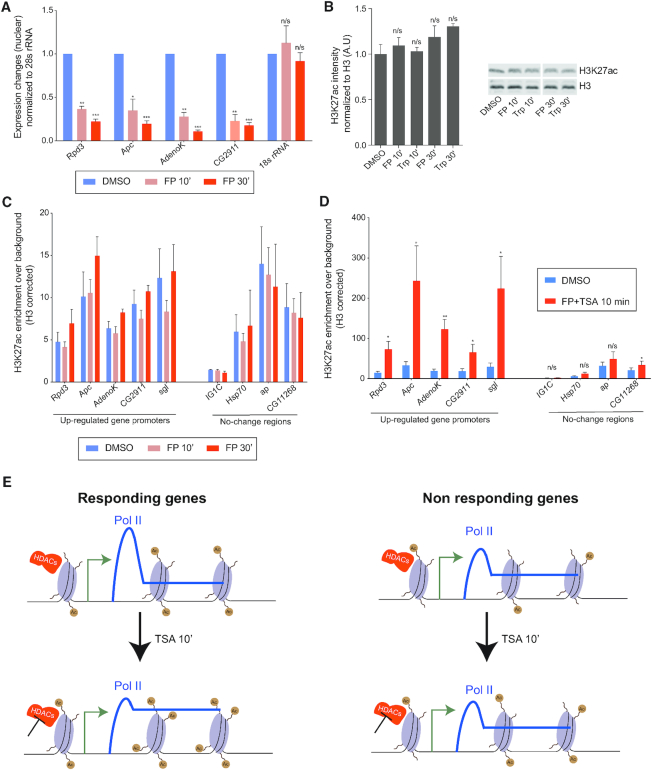
Inhibiting transcription does not prevent an increase in histone acetylation upon HDAC inhibition. (A) RT-qPCR with nuclear RNA isolated from S2 cells treated with DMSO control or Flavopiridol (FP) for 10 or 30 min normalized against 28S rRNA. n = 3. (B) Quantification of H3K27ac Western blot after Flavopiridol (FP) or Triptolide (Trp) treatment, n = 2. A representative blot is shown to the right. (C) H3K27ac ChIP-qPCR at up-regulated gene promoters and control loci from S2 cells treated with DMSO or FP for 10 or 30 min normalized against H3 occupancy. n = 3. (D) H3K27ac ChIP-qPCR at up-regulated gene promoters and control loci from S2 cells treated with DMSO or TSA and FP for 10 min normalized against H3 occupancy. n = 3. (E) Schematic model of the transcriptional response to HDAC inhibition. Error bars represent SEM and significant differences between control and treated cells (two-tailed paired t-test) are indicated by asterisks, * P< 0.05, ** P< 0.01, *** P < 0.001.

