Figure 3.
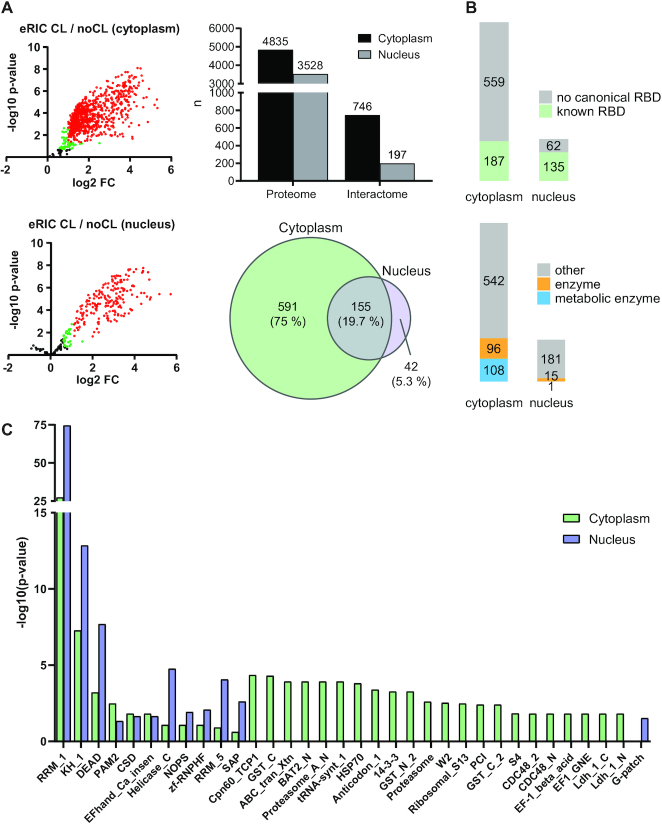
Identification of nuclear and cytoplasmic RBPs. (A) Left panel: volcano plots showing the results of a differential abundance analysis by limma (23). Log2-fold change (FC) of UV-crosslinked over non-crosslinked (x-axis) and log10-fold changes of P-values (y-axis) of RBPs (red: FDR < 0.05, FC > 100%), candidate RBPs (green: FDR < 20%, FC > 50%), and ‘unspecific’ non-RBPs (black) captured by eRIC. The top plot shows the cytoplasmic and the bottom plot the nuclear RBPs. Top right panel: cytoplasmic and nuclear proteins identified in the full proteomes (proteome) and the RBPs identified by the interactome captures (interactome). Bottom right panel: overlap of common RBPs identified in the cytoplasmic and nuclear interactomes. (B) RBPs with known RNA-binding domains (top) and RBPs that are known (metabolic) enzymes (bottom). (C) Analysis of significantly enriched (P.adj < 0.05) protein domains within the identified RBPs.

