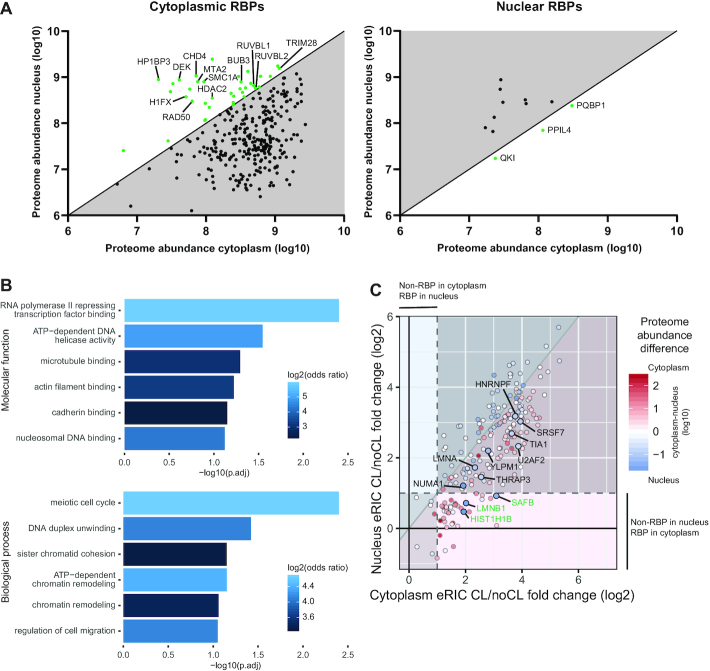
Figure 4.
A subset of RBPs exhibit compartment-controlled RNA-binding activity. (A) Scatter plots of RBPs identified in all full proteomes but only in either cytoplasmic (left) or nuclear (right) interactomes. The axes indicate the cytoplasmic (x-axis) and nuclear (y-axis) proteome abundances based on their top3 values. The top3 value represents the average ms1 intensity of the three most abundant peptides for a protein in the mass spectrometry in log10 scale. Proteins identified as RBPs only in the compartment where they are relatively less abundant are shown in green on white background. Of these, selected cytoplasmic RBPs that are otherwise annotated as nuclear histone and chromatin-associated proteins are named. (B) GO-term enrichment analysis of the cytoplasmic RBPs with higher protein abundance in the nucleus. (C) Correlation of RNA binding activity between cytoplasm and nucleus. The RNA-binding activity is reflected by CL/noCL fold change ratios (log2) of the RBPs in cytoplasmic (x-axis) and nuclear (y-axis) interactomes. Color of dots indicate their abundance difference in full proteomes. Dots on red or blue background show more pronounced RNA binding in the cytoplasm or in the nucleus, respectively. Red or blue dots indicates proteins with higher abundance in the cytoplasm or in the nucleus, respectively. Note that the color intensity of the dots indicates the difference in abundance on a log10 scale. The shaded bottom left area shows proteins identified in both nuclear and cytoplasmic interactomes but not showing significant RBP-activity in either. The upper right shaded are shows bona fide RBPs in both compartments. The light areas show bona fide RBPs only in one compartment as indicated. The highlighted and named proteins are at least 5-fold more abundant in the nucleus while showing an at least 50% higher CL/noCL ratio in the cytoplasm. Bona fide RBPs only in the cytoplasm while being significantly more abundant in the nucleus are named in green. Note that no proteins filled these criteria the other way around. The dashed lines represent the 2-fold enrichment threshold in CL/noCL ratios used for defining bona fide RBPs.

