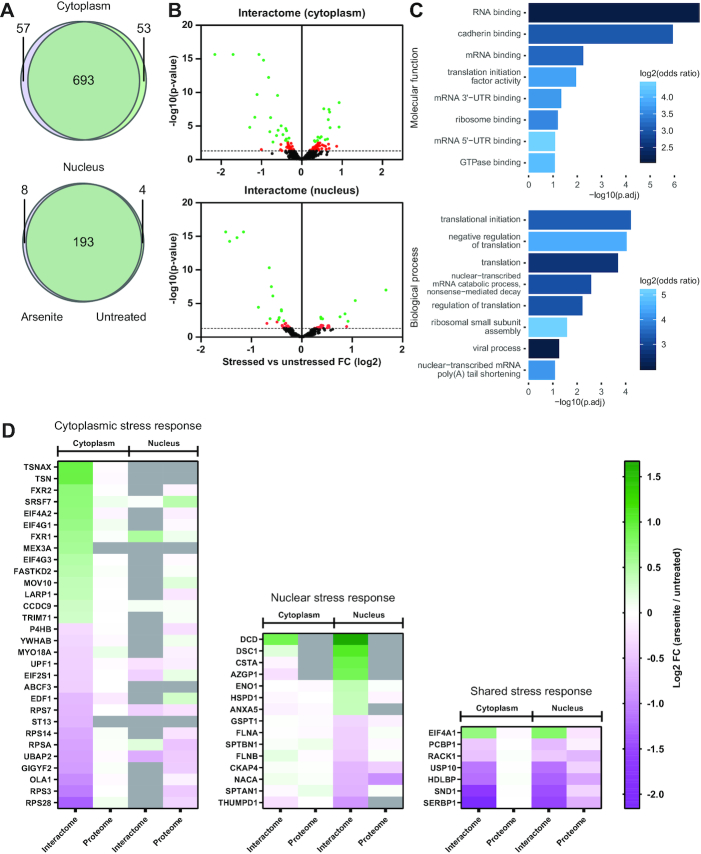
Figure 5.
Stress-induces specific nuclear and cytoplasmic changes of RBP activity. (A) Venn diagrams showing the overlap of RBPs identified in cytoplasmic (top) and nuclear (bottom) interactome captures from both untreated and arsenite-treated cells. (B) Volcano plots showing the arsenite-induced effects in cytoplasmic (top) and nuclear (bottom) RBPs. Limma was used to test for differential abundance between cross-linked fractions of arsenite-treated versus untreated. X-axis: fold change (log2) comparison of treated against untreated CL samples. Y-axis: P-values of the comparisons. Proteins showing arsenite-induced fold changes with FDR <0.05 are shown in green. Proteins with P-value <0.05 but FDR >0.05 are shown in red. The dashed line represents the 0.05 P-value threshold. (C) GO-term enrichment analysis of the stress-affected RBPs. (D) Heat maps of changes of RNA-binding activity induced by stress of RBPs with an FDR <0.05 (interactome) and the corresponding changes in the full proteome (proteome). The color-scale represents the log2 FC of the treated against untreated CL samples. The stress-affected RBPs are divided into three groups, RBPs showing a significant change only in the cytoplasm (left), in the nucleus (middle), or RBPs significantly affected in both compartments (right). Proteins not identified in a specific group are shown in grey.

