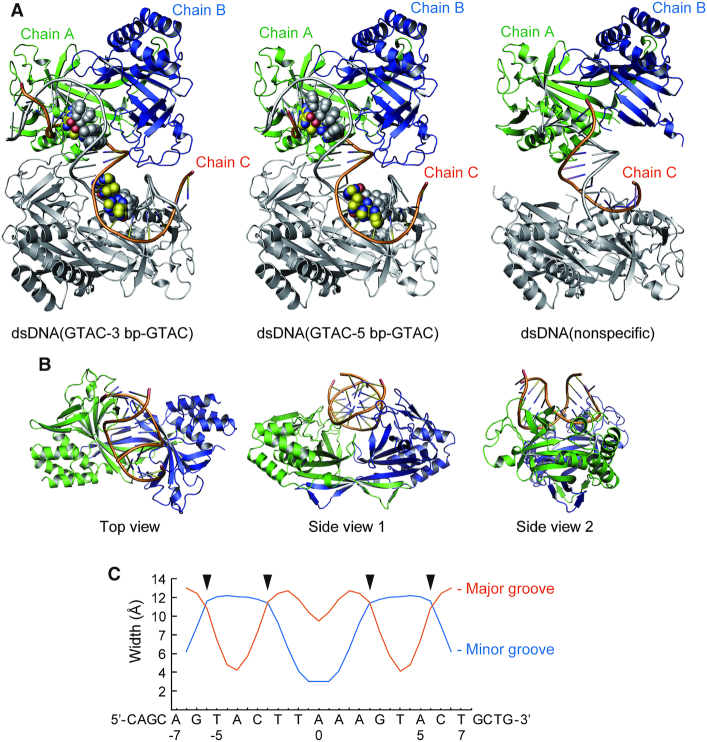
Figure 2.
Overall structures of the R.PabI(Y68F-K154A)–dsDNA complexes. (A) Structures of the R.PabI(Y68F-K154A)–dsDNA(GTAC-3 bp-GTAC), the R.PabI(Y68F-K154A)–dsDNA(GTAC-5 bp-GTAC) and the R.PabI(Y68F-K154A)–dsDNA(nonspecific) complexes in crystals. The R.PabI protomers in the asymmetric unit (chains A and B) are colored green and blue, respectively. The bound DNA strand (chain C) is coloured orange. The R.PabI–dsDNA complex structures generated by a crystallographic 2-fold axis are colored grey. The 5′-GTAC-3′ sequence in the dsDNA is shown in sphere models. (B) Top and side views of the R.PabI(Y68F-K154A)–dsDNA(GTAC-5 bp-GTAC) complex. (C) Major and minor groove widths of dsDNA in the R.PabI(Y68F-K154A)–dsDNA(GTAC-5 bp-GTAC) complex. The positions at which the wedge loops (β2–β3) are inserted are marked with black triangles.

