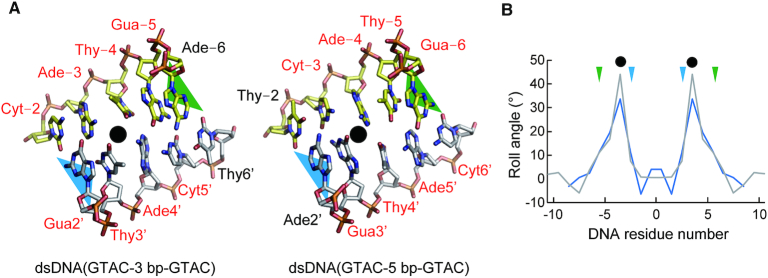
Figure 5.
Distortion of the base stacking. (A) Distorted base stackings in the R.PabI(Y68F-K154A)-dsDNA complexes. DNA bases are shown in stick models. The positions of the wedge loops are shown by green (chain A) and blue (chain B) triangles. The positions of distorted base stackings are indicated by black circles. The DNA residues of the 5′-GTAC-3′ sites are labelled by red font. (B) Roll angles of dsDNA in the dsDNA(GTAC-3 bp-GTAC) complex (gray) and the dsDNA(GTAC-5 bp-GTAC) complex (blue). The wedge loop-inserted regions are marked with triangles. The positions of distorted base stackings are indicated by black circles.

