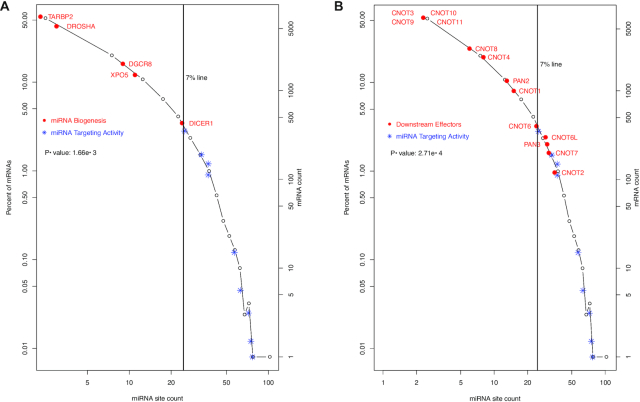
Figure 3.
Lower levels of miRNA-targeting of upstream miRNA biogenesis and downstream regulatory effectors. The histogram in Figure 1 is used to show the contrast in the levels of targeting by miRNAs between two groups of mRNAs. The miRNA biogenesis ( ) and miRNA targeting machinery (
 ) are shown in (A), and the downstream regulatory effectors (
 ) and miRNA targeting machinery (
 ) in (B). In (B), CNOTs 3 and 9–11 share one data point, as they have the same number of miRNA sites. The Mann–Whitney–Wilcoxon test P-values of the contrast between two groups of mRNAs are specified inside both plots.

