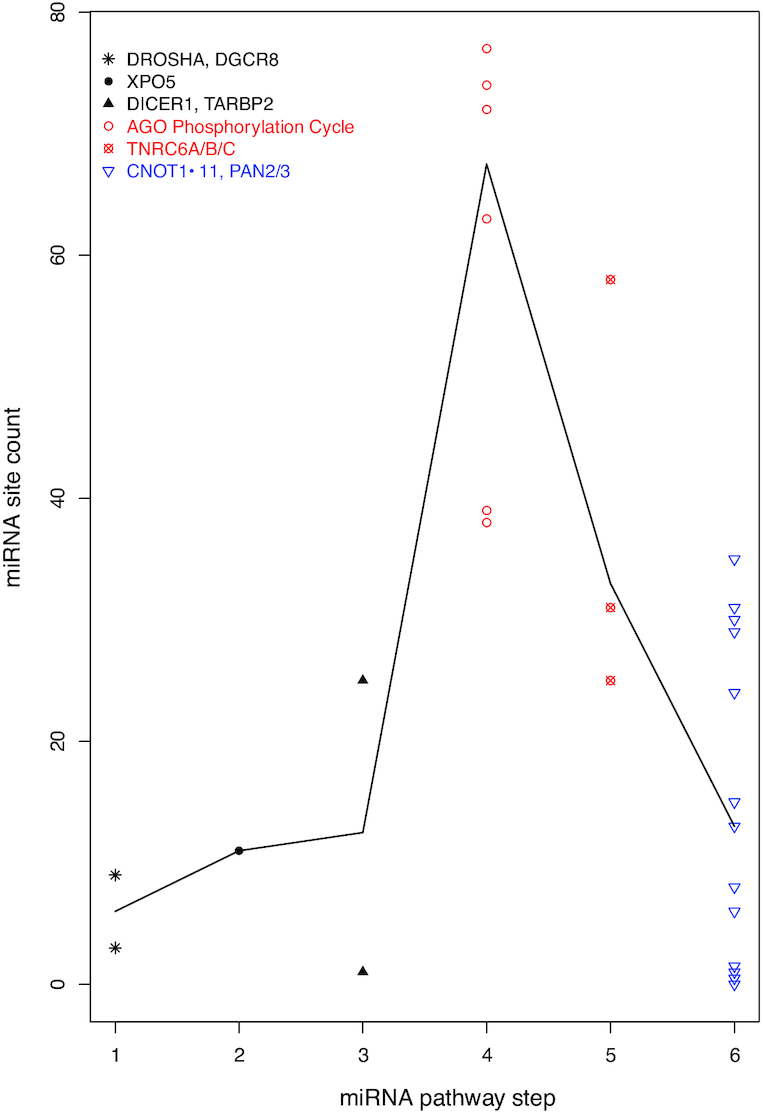
Figure 4.

Specificity of auto-feedback regulation for the targeting segment of miRNA pathway. A scatter plot of mRNA miRNA binding site count is shown, with the mRNAs grouped into six steps of the miRNA pathway. The biogenesis steps are plotted in black, the targeting steps in red and the downstream effector in blue. The black line connects the median site counts of the six steps.
