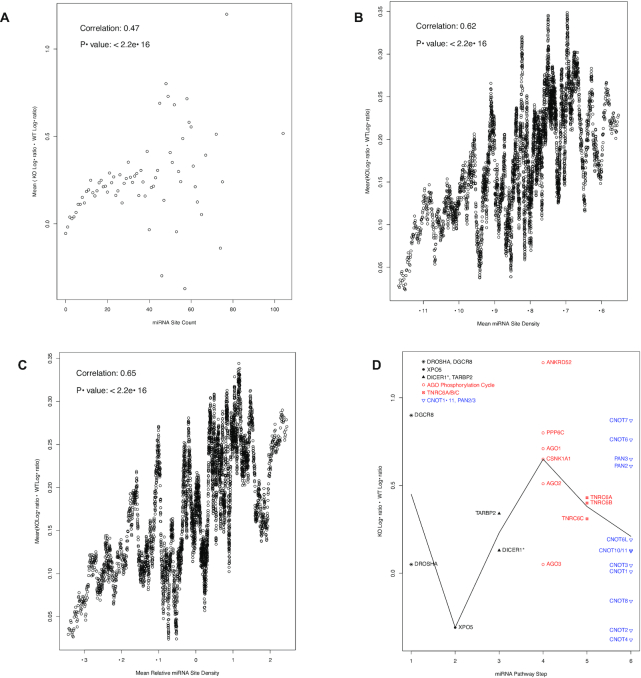
Figure 7.
Overall positive correlation between miRNA site counts and the increases in mRNA translation activity in Dicer1−/− mutant cells (A–C) and the specificity of auto-feedback regulation for the targeting segment of miRNA pathway (D). (A) a scatter plot of miRNA binding site counts (x axis) versus the mean difference between Dicer1−/− (KO) and wild-type (WT) log-ratios of the mRNAs with the corresponding counts (y axis). Spearman correlation coefficient is also shown. For group sizes and the scale-free relationship, please see Figure 1. (B) a scatter plot of the log-ratio difference versus miRNA binding site density, as in Figure 5B. The Pearson correlation and P-value are also shown. (C) a scatter plot of the log-ratios difference versus relative miRNA binding site density, as in Figure 5C. The Pearson correlation and P-value are also shown. (D) a scatter plot of log-ratio difference, with the mRNAs grouped into six steps of the miRNA pathway. As in Figure 4, the biogenesis steps are plotted in black, the targeting steps in red and the downstream effector in blue. The black line connects the mean log-ratio value differences of the six steps. The DICER1 mRNA is annotated with the * symbol to indicate its mutation in the mutant cells.

