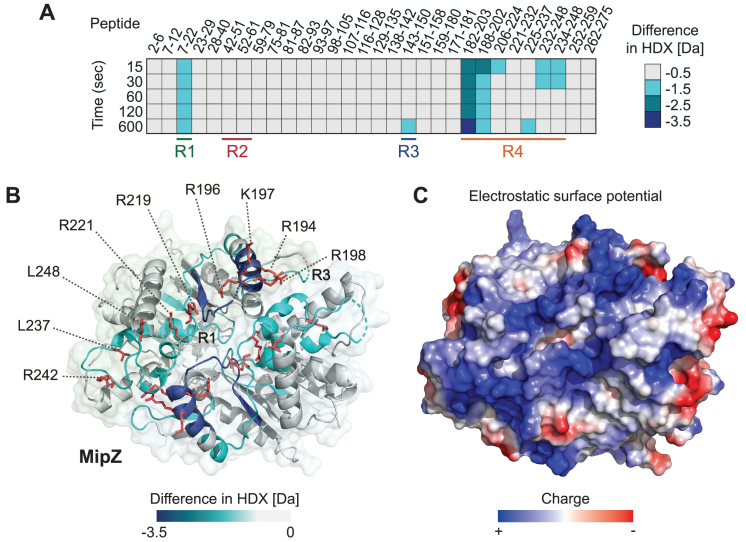
Figure 4.
Hydrogen/deuterium exchange (HDX) analysis of the MipZ-DNA interaction. (A) MipZ-D42A was incubated in deuterated buffer containing 1 mM ATPγS in the absence or presence of a 14 bp dsDNA oligonucleotide (ran14-up/ran14-lo). The heat plot shows the maximal differences in deuterium uptake between the DNA·MipZ-D42A complex and MipZ-D42A alone at different incubation times for a series of representatives peptides (see Dataset S2 for the full list of peptides). The color code is given on the right. All experiments were performed in the presence of ATPγS to further increase the stability of the dimer. The four different regions that are protected upon DNA binding to MipZ or ParA (see Figure 5) are indicated at the bottom. (B) Mapping of the maximum differences in HDX observed upon DNA binding onto the crystal structure of the MipZ dimer (PDB ID: 2XJ9). The color code is given at the bottom. The DNA-binding residues identified in the mutant screen are shown in red. A surface representation of the structure is shown in the background. For clarity, the ATP and Mg2+ ligands are not shown. (C) Electrostatic surface potential of the MipZ dimer. The color code is given at the bottom.

