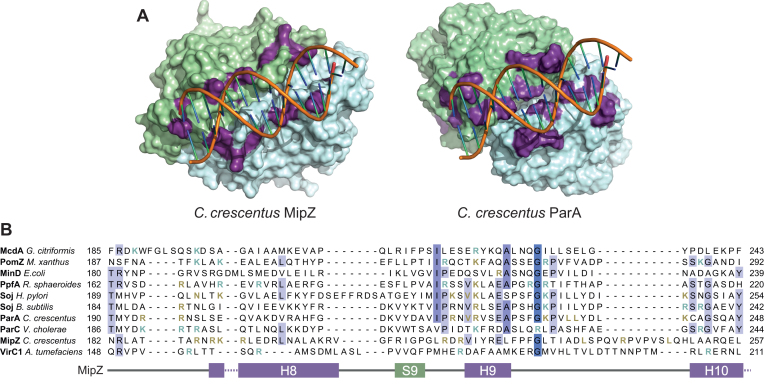
Figure 6.
Variability of the DNA-binding regions of P-loop ATPases. (A) Comparison of the DNA-binding regions of MipZ and ParA from C. crescentus. Shown are surface representations of the dimer structures of MipZ (PDB ID: 2XJ9) and ParA (modeled as described in Figure 5B). Residues shown to be important for DNA binding are highlighted in purple. Short dsDNA oligonucleotides were modeled into the experimentally verified DNA-binding interfaces. The two subunits of each dimer are depicted in green and blue, respectively. (B) Alignment of the DNA-binding regions of the indicated P-loop ATPases (see Supplementary Figure S10 for details), corresponding to region R4 from Figures 4 and 5. Conserved residues are highlighted in blue. Residues proven to be involved in DNA-binding are colored orange. Residues predicted to have a role in DNA binding (see also Supplementary Figure S12) are shown in cyan. The corresponding secondary structural elements of MipZ from C. crescentus (13) are indicated at the bottom. See Supplementary Figure S10 for an alignment of the full-length sequences.

