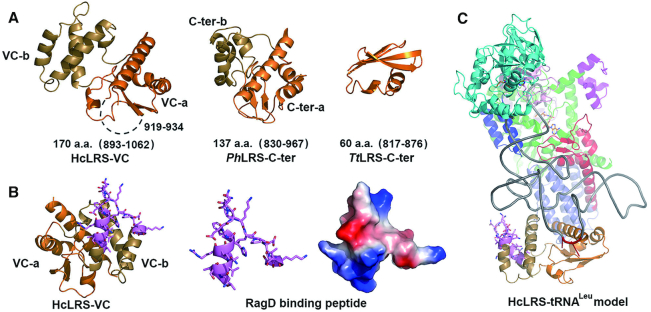
Figure 4.
The structure of VC domain. (A) The cartoon representation of VC domain that composed of VC-a (orange) and VC-b (sand), and the structure of equivalent C-ter domains of PhLRS and TtLRS are shown for comparison. (B) Stick (left and middle) and electrostatics surface (right) representations of the RagD binding peptide of VC domain; (C) A proposed model of hcLRS–tRNALeu complex shown in cartoon, tRNALeu is shown in gray.

