Figure 2.
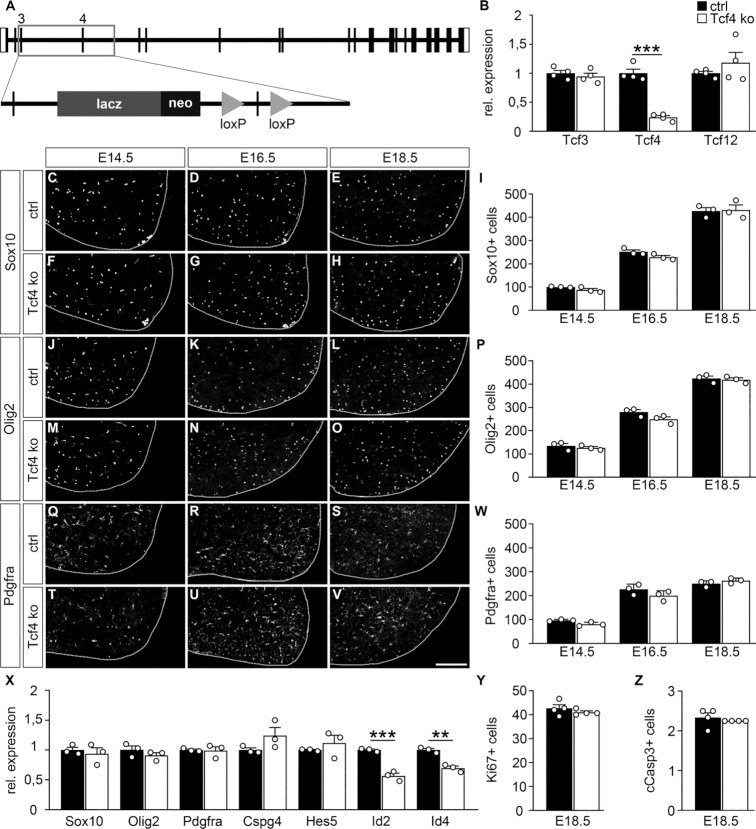
Oligodendroglial development in the prenatal spinal cord of Tcf4ko mice. (A) Schematic representation of the mutant Tcf4 allele with an insertion of a lacZ cassette in intron 3 and a floxed exon 4. (B) Quantitative RT-PCR to determine Tcf3, Tcf4 and Tcf12 transcript levels in the spinal cord of control (ctrl, black bars) and Tcf4ko (white bars) mice at E18.5. Values for each gene in control spinal cord were set to 1 and levels in Tcf4ko spinal cord were set in relation to this (n = 4). (C–W) Immunohistochemical stainings of spinal cord sections from control (C–E, J–L, Q–S) and Tcf4ko (F–H, M–O, T–V) mice at E14.5 (C, F, J, M, Q, T), E16.5 (D, G, K, N, R, U) and E18.5 (E, H, L, O, S, V) with antibodies directed against Sox10 (C–E, F–H), Olig2 (J–L, M–O) and Pdgfra (Q–S, T–V), and corresponding quantifications (I, P, W). For stainings, the right ventral horn is shown, placed on a black background and demarcated by a stippled line. Scale bar: 100 μm. For quantifications absolute mean numbers of marker-positive cells ± SEM per thoracic spinal cord section of control and Tcf4ko mice are shown (n = 3 mice for each genotype, counting three separate sections). (X) Quantitative RT-PCR to determine Sox10, Olig2, Pdgfra, Cspg4, Hes5, Id2 and Id4 transcript levels in the spinal cord of control and Tcf4ko mice at E18.5. Values for each gene in control spinal cord were set to 1 and levels in Tcf4ko spinal cord were set in relation to this (n = 3). (Y, Z) Quantification of Ki67-positive (Y) and cleaved caspase 3-positive (Z) oligodendroglial cells in spinal cord sections from control and Tcf4ko mice at E18.5 (n = 4 mice for each genotype, counting three separate sections). Differences to controls were statistically significant as determined by two-tailed Student's t test (**P ≤ 0.01; ***P ≤ 0.001).

