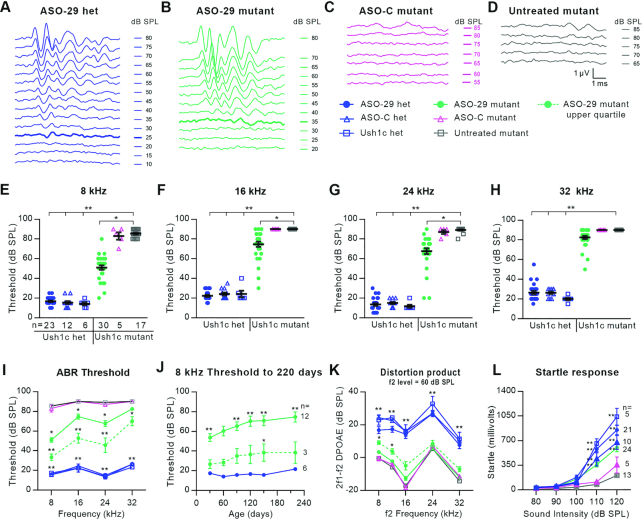
Figure 5.
ASO-29 rescues behaviorally-relevant auditory function that is sustained longitudinally. (A–D), ABR waveforms at 8 kHz from a representative of each of the four treatment groups. ABR thresholds are indicated by the thickened traces in (A) and (B); no thresholds were detected in the ASO-C treated mutant or the untreated mutant in (C) and (D). (E–H) Individual ABR thresholds at the four frequencies tested for every animal in the six treatment groups at P30. (I) ABR thresholds ± SEM for the cohorts in (E–H). The dotted line shows the average ABR thresholds ± SEM for seven ASO-29-treated animals in the upper (top-performing) quartile. (J) ABR thresholds ± SEM for 12 ASO-29-treated mutants followed through 220 days. Average thresholds for the upper quartile (n = 3) are significantly different from treated heterozygotes only at 140 days. (K) Distortion product otoacoustic emission (DPOAE) responses to an f2 stimulus of 60 dB SPL across frequencies ± SEM. The dotted line shows the average of 7 ASO-29-treated animals in the upper quartile (same subjects as in 5I, dotted line). n values in (E) apply to panels (F–I) and (K). (L) Acoustic startle reflex responses ± SEM. Statistical tests: panels (E–I) and (K): Kruskal–Wallis H Test with Dunn's Multiple Comparison Test comparing all groups to untreated Ush1c mutant; panel (J): repeated measures two-way ANOVA with Dunnett's Multiple Comparison Test comparing ASO-29-treated mutants to ASO-29-treated heterozygotes. (L), same as (J), but comparing all groups to untreated Ush1c mutant. *P < 0.05 and **P < 0.01. Level of significance for the comparisons involving each of the three heterozygous control groups is P < 0.01 and represented by a single asterisk pair in (I) and (K) (**) to reduce the visual complexity of the graph.

