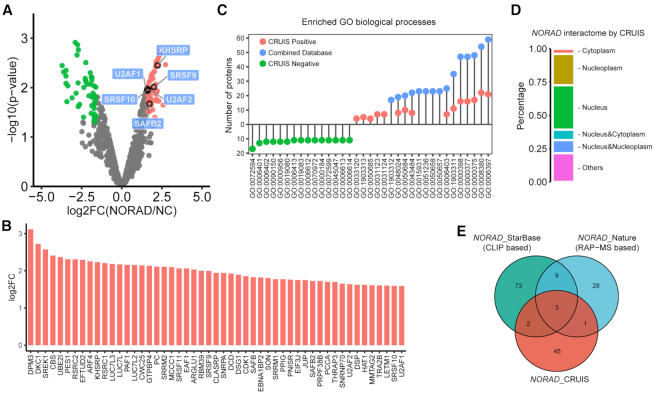
Figure 3.
Capturing RNA-binding proteins of NORAD by CRUIS. (A) The target RBPs were determined by a moderated t-test (P value < 0.05) and fold change (fold change > 3). (B) Bar plot of log2 fold change (log2FC) of the identified proteins in NORAD interactome by CRIUS. (C) The top 15 GO-enriched biological processes of proteins in NORAD interactome by CRUIS (red dots), the negative control (green dots) and combined datasets (light blue dots). (P-value < 0.01, P.adjust < 0.05). (D) Subcellular distribution of the identified proteins in NORAD interactome by CRIUS. (E) Comparison of NORAD interactome by CRUIS with the two public datasets: RAP MS (16) and StarBase v2.0 database (17).

