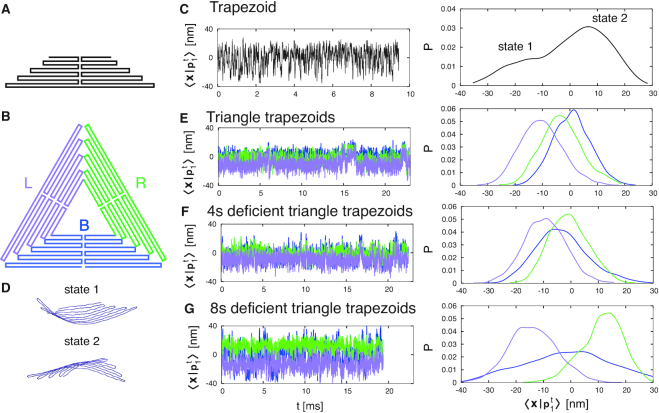
Figure 3.
(A) Schematic representation of the scaffold routing map of the isolated trapezoid. (B) Labeling (and associated color) of the three trapezoids composing each triangle: left (L) in purple, right (R) in green and bottom (B) in blue. (C) On the left, projection of trapezoid trajectory along its first eigenvector. On the right, distribution of the projection, showing the existence of two alternate states, depicted in (D). (E–G) On the left, trajectory projection, for each trapezoid substructure composing the three triangles (L, R, B), along the eigenvector of the isolated trapezoid. On the right, distributions of these projections. The line color corresponds to the one defined in (B). In the triangle, the three trapezoids oscillate synchronously between the two trapezoid states. The oscillations correspond to those of the triangle (Figure 2A). The same oscillations appear in the 4sd triangle trapezoids, while in the 8sd triangle the oscillations are decoupled. At the same time, the R-trapezoid distribution peak moves over state 2 while increasing the defect size, and the distribution of the B-trapezoid broadens.

