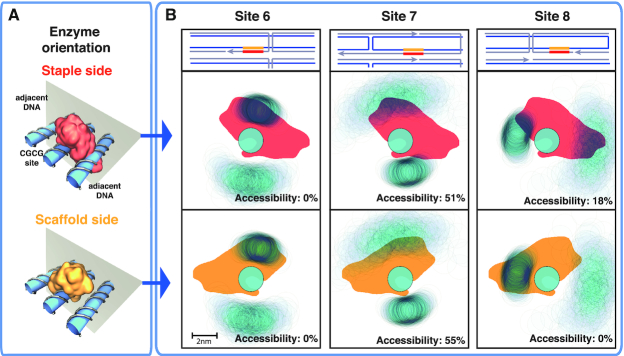
Figure 5.
(A) Representation of HinP1I enzyme docking onto the GCGC site in DNA origami, either from the staple strand side or from the scaffold strand side (top and bottom panel, respectively). The adjacent DNA helices are also shown. (B) Top row, local arrangement of the DNA structures surrounding sites 6, 7, 8. The scaffold (staple) strand is colored blue (gray); two close parallel lines denote a DNA double helix, and orthogonal lines describe the path of crossover junctions. Middle (bottom) row, projections of the enzyme docked on the GCGC site from the staple (scaffold) side, colored in red (yellow); of the center of mass of the DNA helix bearing the GCGC site and of the two adjacent DNA helices (in light blue, with a diameter of ∼2 nm), for sites 6, 7 and 8. The reference frame is the position of one nucleotide of the GCGC site; thus, the positions of the enzyme and the GCGC site are fixed, while the position of the adjacent DNA helices fluctuate, forming clouds with intensities proportional to the probability that a given area is occupied by the DNA helix. For each projection, the theoretical accessibility is reported in the panel. For site 6, the enzyme always overlaps with the upper adjacent DNA helix, resulting in inaccessibility from both sides. For site 7, the enzyme overlaps half of the time with the upper DNA helix from both sides; thus, it is partially accessible in both cases. For site 8, the enzyme overlaps with the left adjacent DNA structure, thus creating inaccessibility only from the scaffold side.

