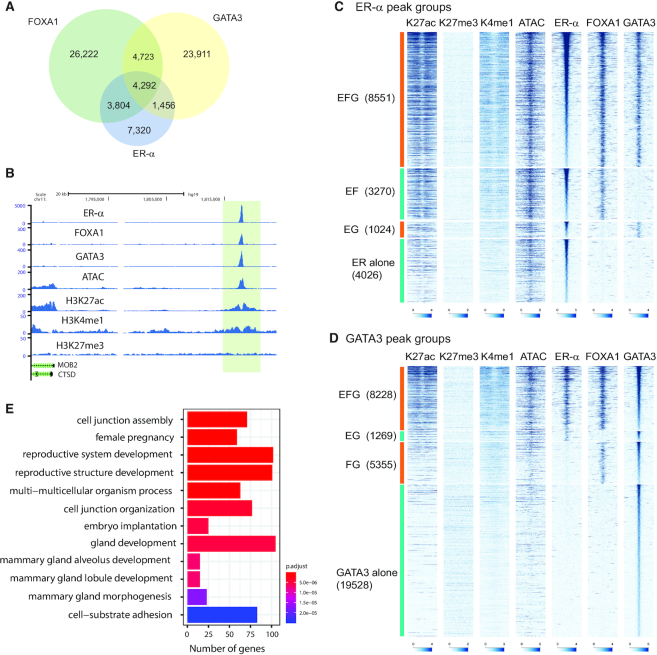
Figure 1.
Chromatin architecture at ER-α -FOXA1-GATA3 colocalization sites. (A) Venn diagram showing overlap between ER-α, FOXA1 and GATA3 peaks in T47D cells. (B) Representative genome browser tracks at an exemplar ER-α -FOXA1-GATA3 co-localized locus. (C, D) Heatmap showing H3K27ac, H3K27med, H3K4me1, ATAC, ER-α, FOXA1 and GATA3 ChIP-seq in each ER-α (C) or GATA3 (D) peak category. (E) Biological pathway analysis of genes associated with EFG peaks. Top 12 significantly enriched pathways are shown.

