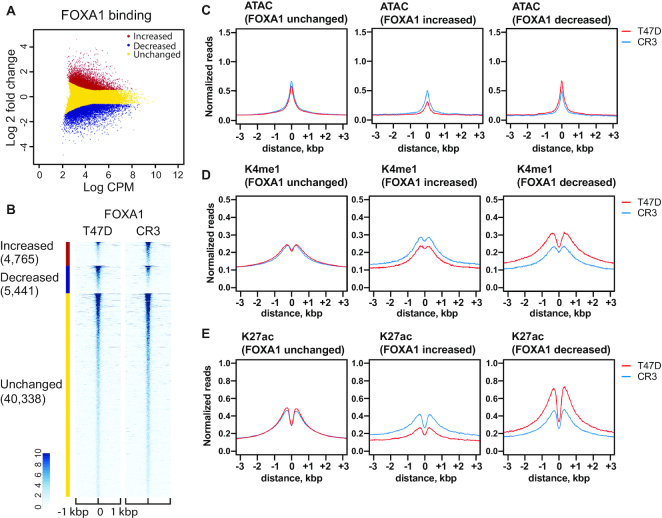
Figure 3.
R330fs mutation reshapes FOXA1 distribution and chromatin architectures. (A) Scatter plot showing differential binding of FOXA1 at FOXA1 peaks in wild-type versus mutant T47D cells. CPM indicates counts per million in each peak. Increased, decreased, unchanged binding events are shown in red, blue, and yellow, respectively. (B) Heatmap analysis displaying normalized read density of FOXA1 ChIP-seq at FOXA1 peaks in T47D (left) or CR3 (right) cells. (C–E) Metaplot profiles of normalized ATAC-seq (C), H3K4me1 ChIP-seq (D) and H3K27ac (E) signals at FOXA1 ChIP-seq peaks in T47D (red) or CR3 (blue) cells.

