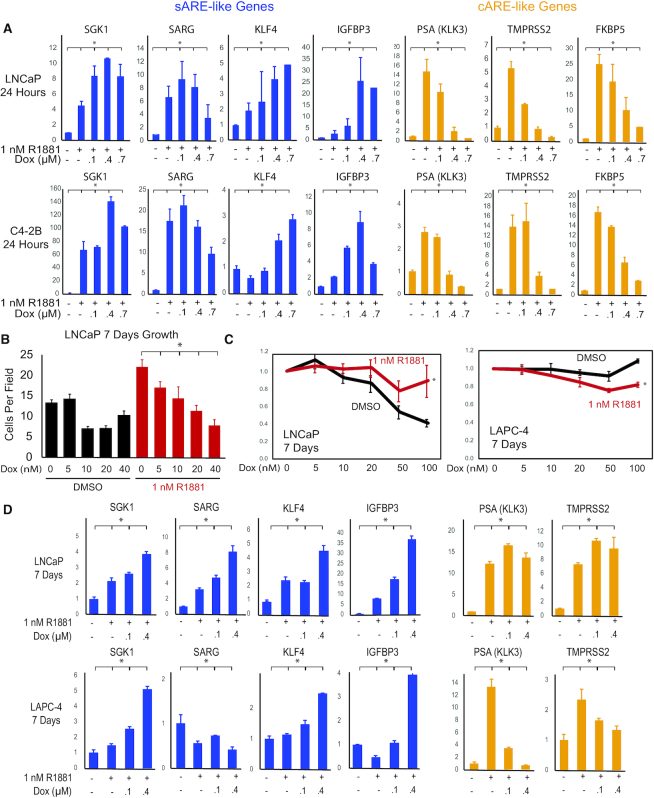
Figure 2.
In vitro validation of dox-mediated induction of sARE-like AR target genes and inhibition of cARE-like AR target genes. (A) LNCaP and C42B cells were plated in six-well plates in RPMI 1640 medium with 10% FBS for 2 days, then hormone-starved in 2.5% CSS for 24 hrs prior to treatment with 1 nM R1881 alone or with varying dox concentrations for 24 h. Q-RT-PCR analysis of total RNA extracted from cells was used to quantify gene expression. Genes indicative of sARE response are SGK1, SARG (C1orf116), IGFBP3, and KLF4; genes representing the cARE pattern of response are PSA (KLK3), TMPRSS2, and FKBP5. (B) Dose response of in vitro growth (cell count, n = 10, error bars indicate SD) of LNCaP cells treated with increasing concentrations of dox, with (red) or without (black) hormone treatment (1 nM R1881) for 7 days. (C) Cell growth was assayed for 5 × 10³ LNCaP or LAPC4 cells seeded per well in 96-well plates in complete media, then starved 2 days in CSS prior to treatment as indicated (black, no R1881; red, 1 nM R1881; dox concentration is shown at bottom). Cells were harvested and MTT assays (n – 5) performed after 7 days. Proliferation relative to control is plotted; error bars indicate SD. (D) Q-RT-PCR analysis of total RNA extracted from LNCaP and LAPC-4 cells under the same growth conditions as in A to quantify gene expression after a 7-day treatment with R1881 (1 nM) alone or with varying dox concentrations. Fold-changes were normalized to β-actin and data plotted relative to the average of untreated control with error bars representing SD (* indicates P < 0.001).

