
Figure 8.
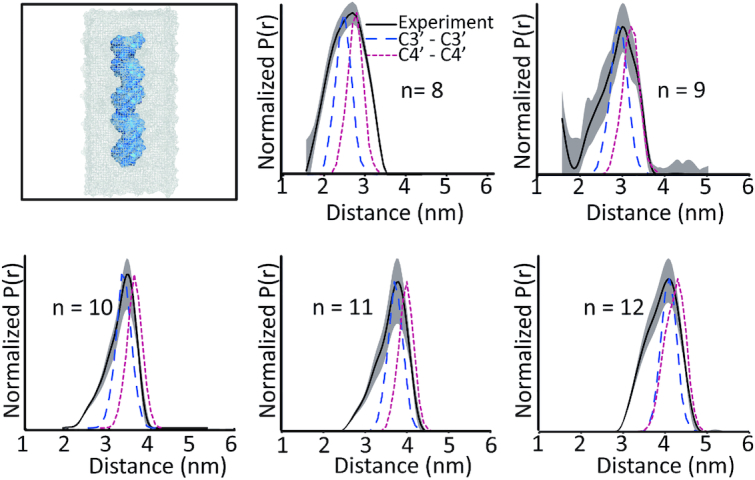
The first panel shows the DNA duplex inside a water box, used in our simulations. C3′–C3′ (blue dashed) and C4′–C4′ (red dotted) distance distributions obtained from MD simulations and experimental distance distributions (black solid). MD simulated distributions show a good agreement with the experimental most probable distance, within 1–2 Å.